.png)

Starting a restaurant is exciting, but let's be honest—it's also financially terrifying. With 60% of restaurants closing within their first year, understanding revenue expectations isn't just helpful, it's survival. Whether you're dreaming of opening your first restaurant or trying to figure out if your current numbers are on track, this guide breaks down everything you need to know about restaurant revenue and profit margins.
Here's the truth nobody wants to talk about: restaurant revenue varies wildly, and the numbers might surprise you.
The median annual revenue for a full-service restaurant sits between $750,000 and $1.2 million. But before you start counting that money, remember this represents gross revenue—before you pay for anything.
Quick-Service (Fast Food)
Think McDonald's efficiency with razor-thin margins but high volume.
Fast-Casual
The sweet spot many operators aim for—better than fast food, easier than full-service.
Casual Dining
Your typical neighborhood restaurant where families go for dinner.
Fine Dining
High revenue, high costs, high stress—but potentially high rewards.
Food Trucks
Here's a metric that tells the real story:
If you're hitting the higher end of these ranges, you're doing something right.
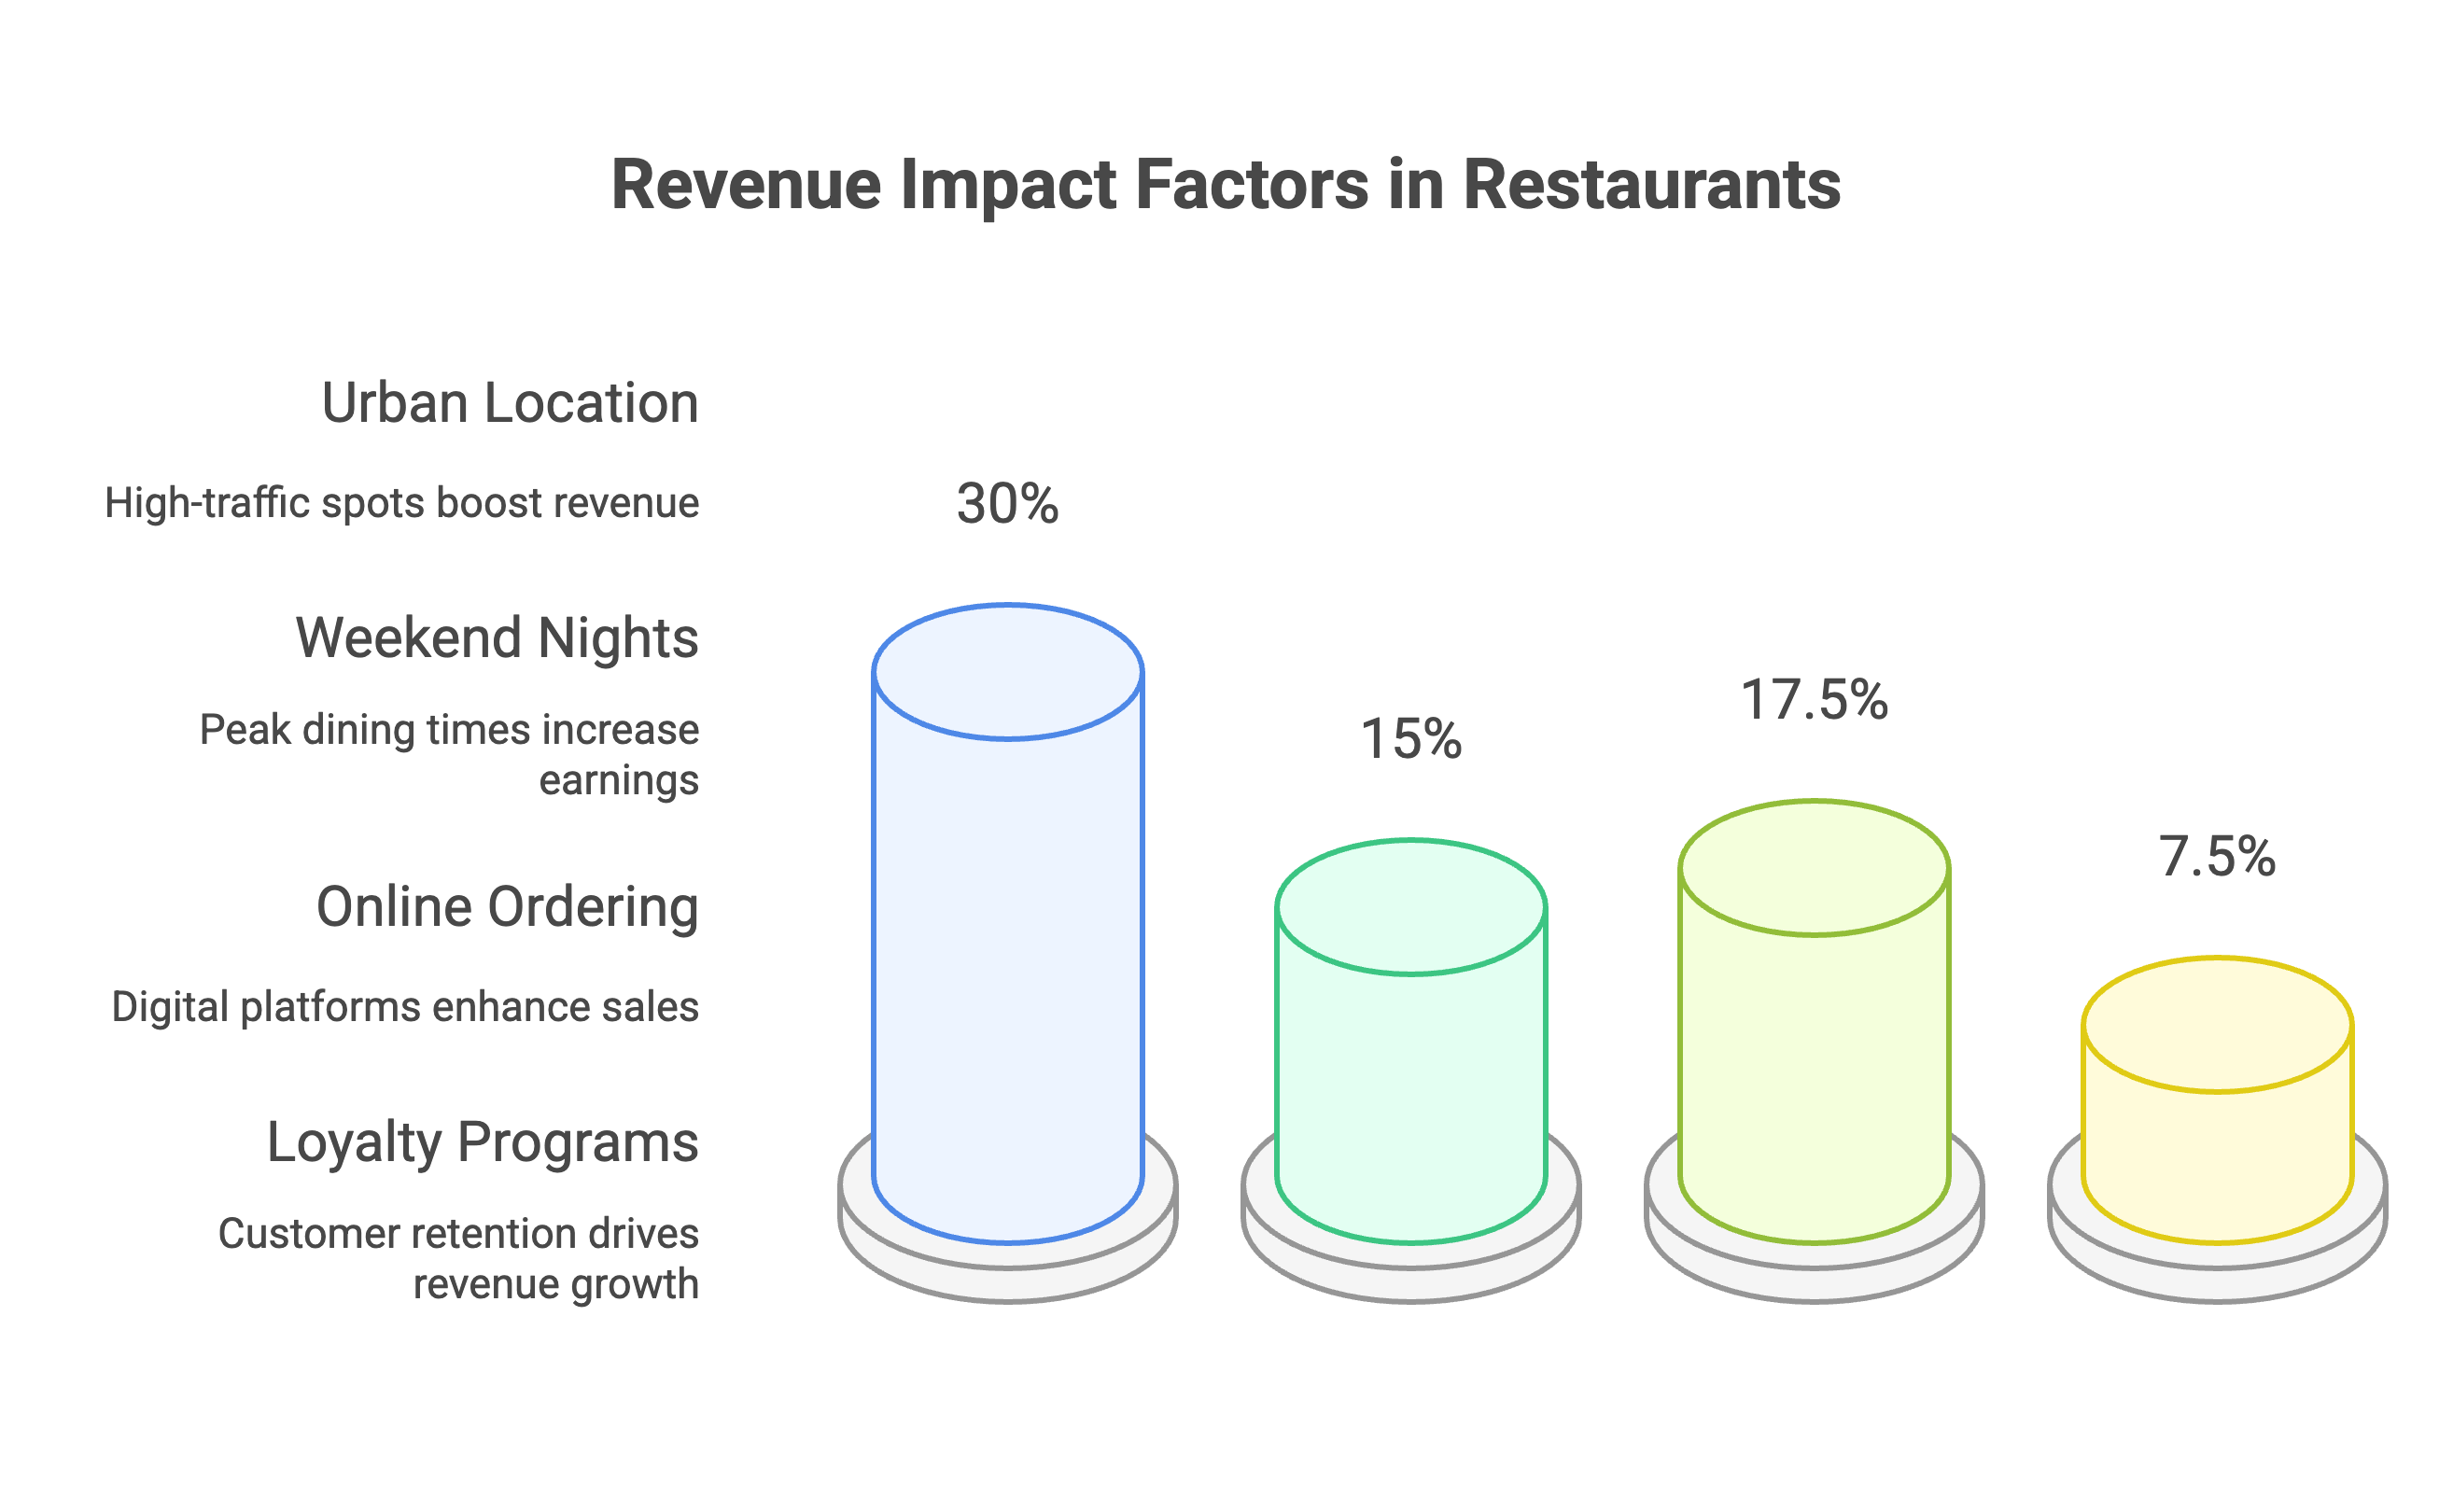
Urban, high-traffic spots can generate 20-40% higher revenue than suburban locations. But here's the catch—rent in those prime spots can eat up 15% of your revenue instead of the ideal 6-8%.
A steakhouse in the same location as a pizza joint will likely do different numbers. Premium concepts command higher prices, but they also have higher expectations and costs.
Weekend nights (Friday and Saturday) typically generate 25-30% of your weekly revenue. If you're not open when people want to eat, you're leaving money on the table.
Restaurants using online ordering see 15-20% revenue increases. Loyalty programs boost revenue by 5-10%. The days of pen-and-paper operations are over.
Now for the sobering part—profit margins in restaurants are notoriously slim.
Yes, you read that right. Even successful restaurants often operate on single-digit profit margins.
Food Costs: 28-32% of revenue
Labor Costs: 25-35% of revenue
Rent: 5-10% of revenue
Operating Expenses: 15-20% of revenue
Restaurants with strong beverage programs see 2-3% higher profit margins. Why? Alcohol has 70-80% gross margins compared to 60-65% for food. A good wine and cocktail program isn't just nice to have—it's financially essential.
If you're in your first year and feeling overwhelmed by the numbers, you're not alone. Here's what to expect:
Most successful restaurants hit 75-85% of their mature revenue potential by year one.
Financial experts recommend having 6-12 months of operating expenses in reserve. The restaurants that survive understand this pattern and plan accordingly.
Analyze what sells and what doesn't. Restaurants that optimize their menus see 5-10% increases in average check size. Remove the "dogs" (unpopular, unprofitable items) and promote the "stars" (popular and profitable).
Offering three price tiers (good, better, best) can increase average check size by 15-20%. People tend to avoid the cheapest and most expensive options, landing in the profitable middle.
Watch out for these warning signs:
Restaurant finances are complex, and small mistakes can have big consequences. Whether it's optimizing your cost structure, planning for growth, or navigating tax obligations, professional guidance can make the difference between struggling and thriving.
At Madras Accountancy, we specialize in restaurant and hospitality businesses. We understand the unique challenges of food service operations and help restaurant owners:
Ready to get your restaurant finances on track? Contact us today to discuss how our specialized expertise can help you maximize profitability and build a sustainable restaurant business.
Restaurant revenue expectations should be grounded in reality, not optimism. While the industry averages provide a starting point, your specific results depend on execution, location, concept, and a dozen other factors.
The most successful restaurant owners focus on both sides of the equation—growing revenue while controlling costs. They understand that a $1 million restaurant with 2% profit margins is less successful than a $600,000 restaurant with 8% margins.
If you're planning a restaurant, use these benchmarks for realistic financial projections. If you're operating one, compare your numbers to industry standards and identify improvement opportunities.
Remember, understanding the average doesn't mean accepting average results. The best restaurants find ways to exceed industry benchmarks through superior execution, smart technology use, and relentless focus on both revenue and profitability.
Success in the restaurant business isn't just about serving great food—it's about understanding the numbers behind every plate that leaves your kitchen.
Compare a bookkeeper and CPA so your business knows when it needs recordkeeping, tax filing, planning, or higher-level advice.
Learn when to outsource bookkeeping, what tasks to hand off first, and how outsourced bookkeeping supports tax planning and decisions.

Use this ecommerce sales tax checklist to review nexus, registrations, marketplaces, product taxability, filings, and bookkeeping records.