.png)

In today's data-driven environment, financial decision-making is no longer based solely on gut instinct or historical reports. Businesses, especially CPA firms and their clients, need up-to-date insights into key performance indicators and financial metrics to remain competitive and compliant. This is where business intelligence (BI) dashboards come into play as essential tools for modern accounting operations.
A business intelligence dashboard turns raw financial data into clear, visual stories that help decision-makers track business performance, uncover risks, and identify opportunities. These dashboard solutions consolidate multiple data sources into a single, intuitive interface that displays everything from cash flow trends to client billing cycles through effective data visualization.
For accountants, these business intelligence dashboards go far beyond spreadsheets and static reports. They provide real-time data visibility, automate tracking of key performance indicators, and support better client advisory services. A well-designed dashboard becomes a powerful business intelligence tool that transforms how accounting professionals interact with financial information.
At Madras Accountancy, we help CPA firms implement offshore-powered dashboard solutions that bring together accounting, tax, and operational data in a unified view. In this guide, we cover the importance of business intelligence dashboards in accounting, the KPIs that matter most, and how to design and deploy dashboard systems that truly support business performance improvement.
A business intelligence dashboard is a digital interface that visualizes data from multiple sources in real-time. For accountants and finance teams, these dashboard solutions provide at-a-glance insights into financial health, client performance, cash position, revenue trends, and other critical KPIs.
Unlike traditional reports that require manual preparation and analysis, a business intelligence dashboard is dynamic. These dashboard systems update automatically as new real-time data flows in and can be customized to highlight the key performance indicators that matter to your firm or your clients.
A typical financial dashboard pulls data from:
Using platforms like Power BI, Tableau, Klipfolio, or Google Data Studio as business intelligence tools, these dashboard solutions help finance professionals:
When used correctly, a business intelligence dashboard becomes not just a reporting tool, but a strategic advantage that enhances business performance monitoring.
Accounting professionals and small business owners are increasingly expected to act on financial data, not just report it. Dashboard solutions make this easier by surfacing trends, enabling comparisons, and making complex data points understandable through effective visualization.
Dashboard systems reduce the time spent digging through reports or reconciling data manually. With live business intelligence dashboards, business leaders and accountants can make decisions based on the latest real-time data rather than waiting for month-end close.
For example, instead of running three separate reports to assess revenue, expenses, and accounts receivable, a single financial dashboard can show all of these key performance indicators side by side in one interface with integrated data visualization.
Small businesses often operate with tight margins and short cash cycles. Waiting until the end of the quarter to assess financial health through traditional reporting can lead to missed opportunities or avoidable risks.
Real-time business intelligence dashboards help answer critical questions like:
These insights are available instantly through dashboard visualization, helping businesses stay agile and responsive to changing conditions.
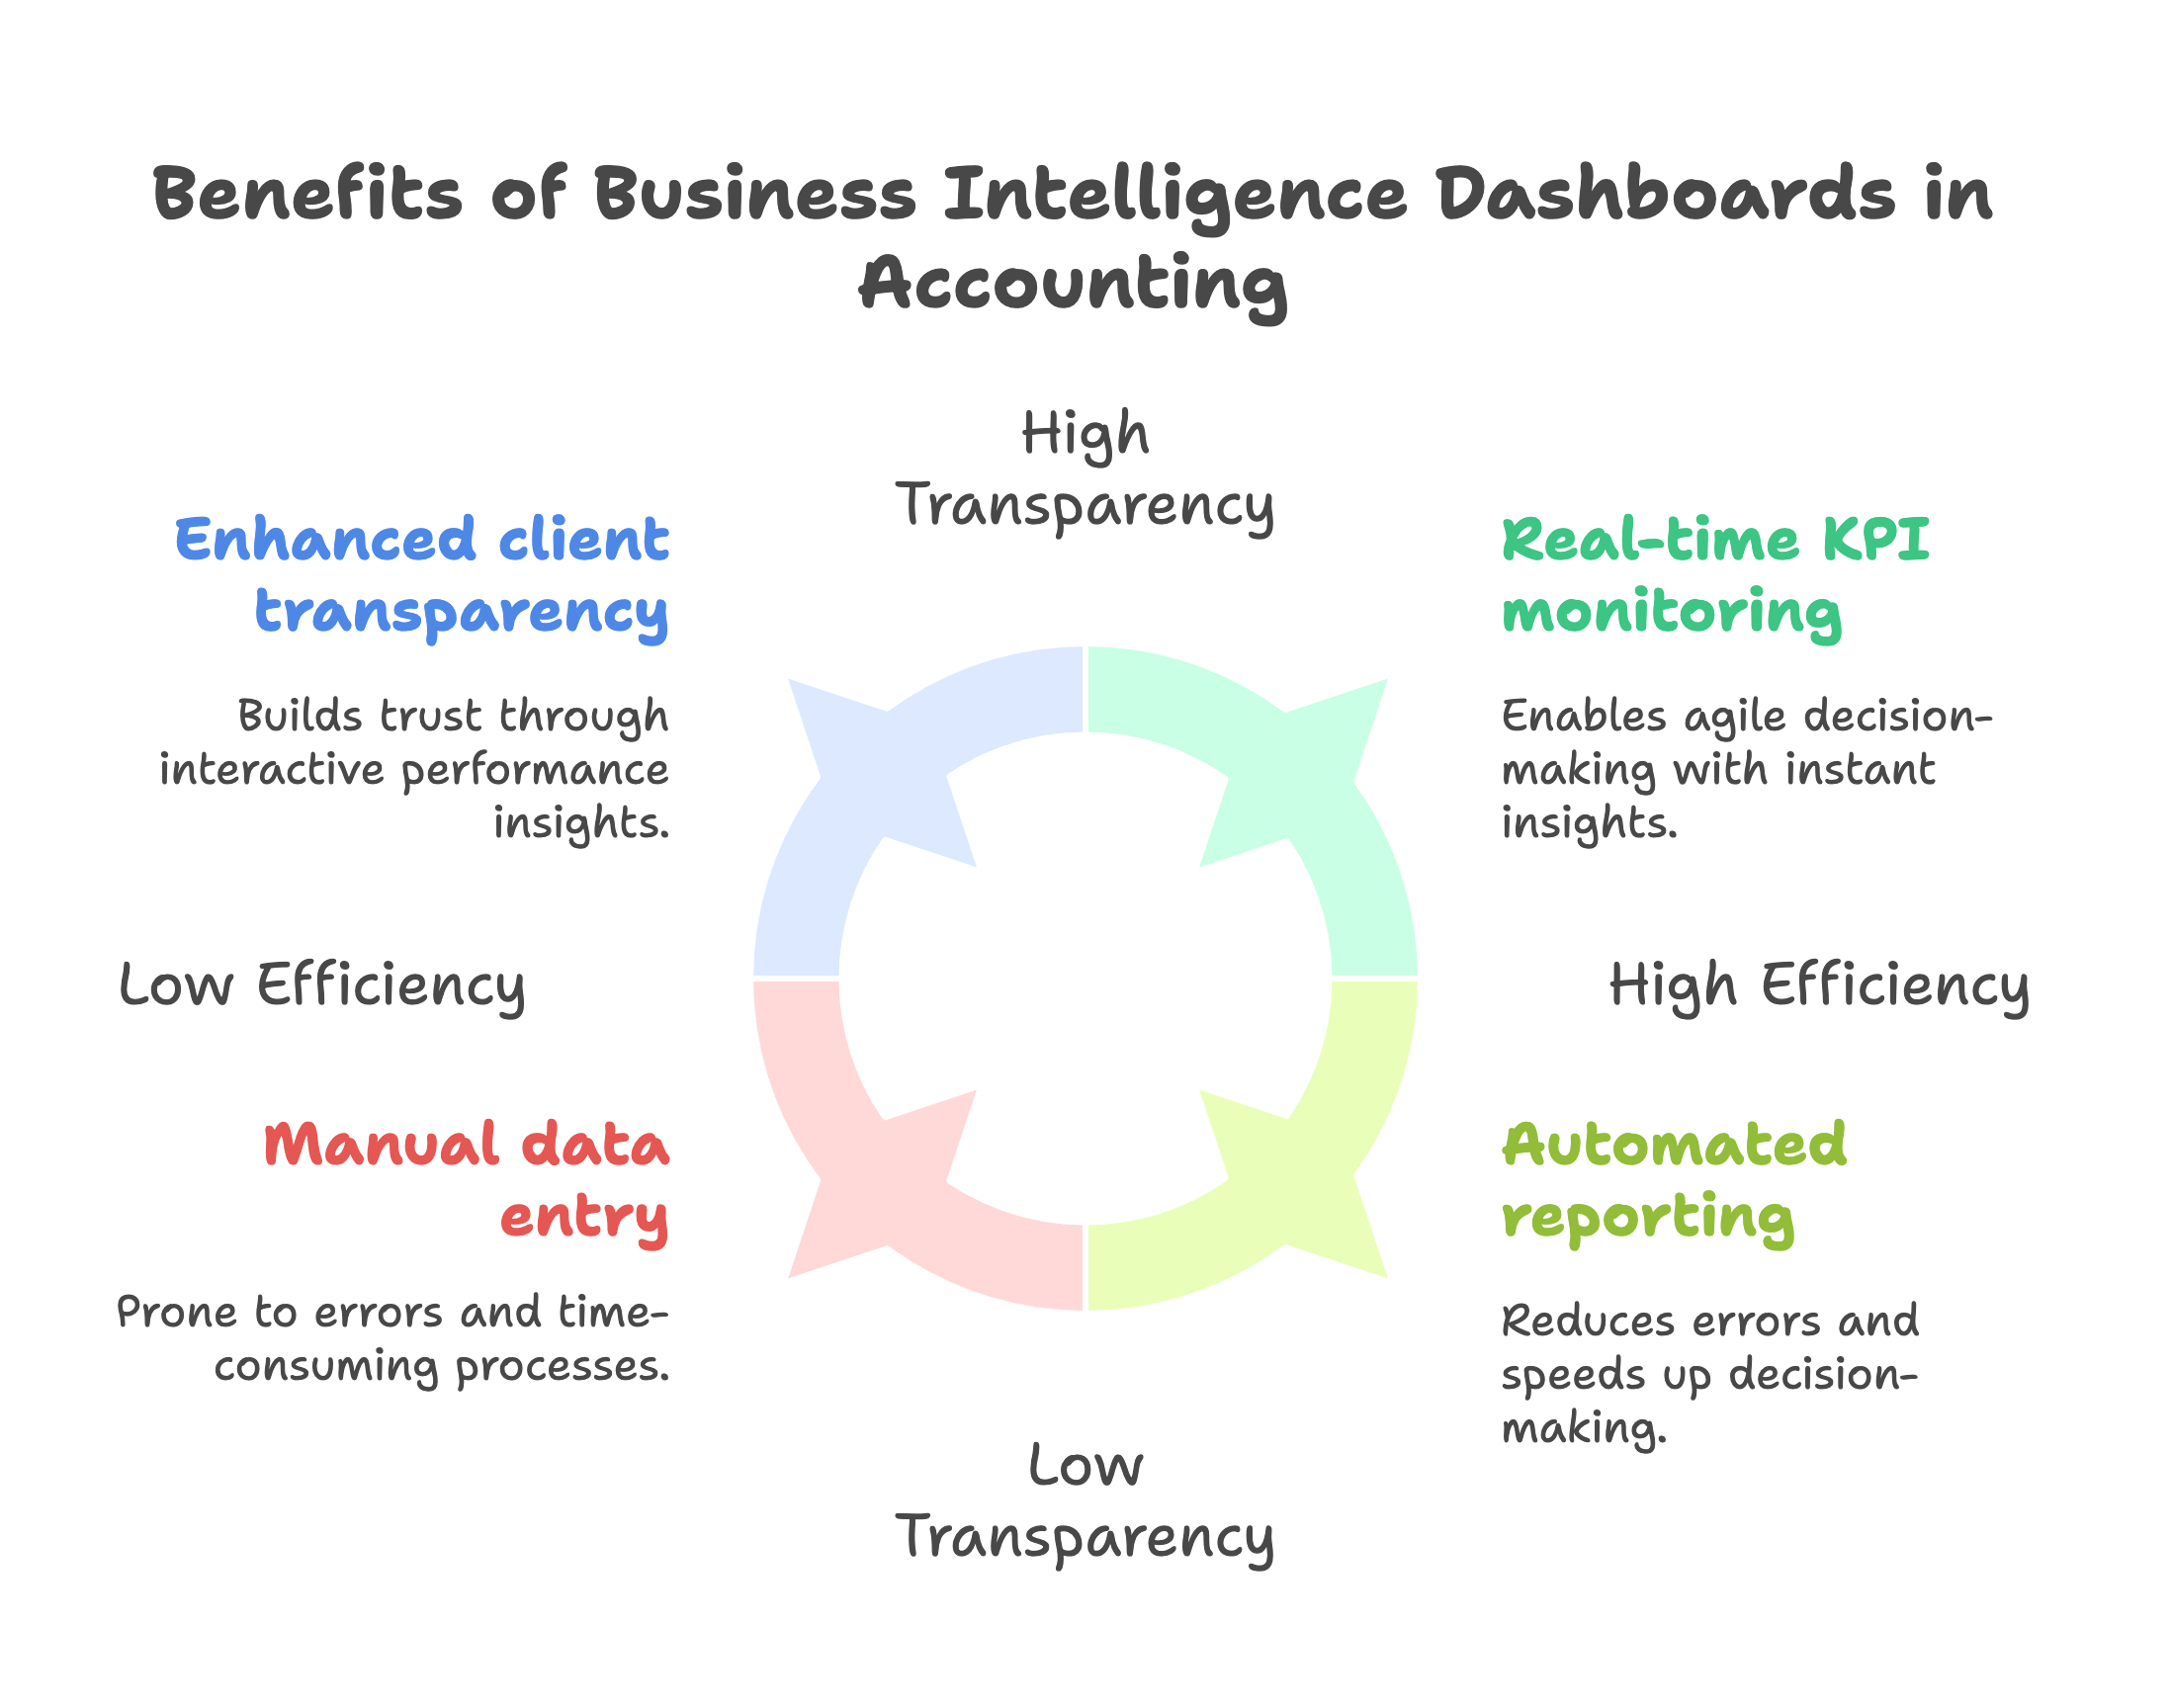
For CPA firms, offering business intelligence dashboard solutions to clients can enhance advisory relationships. Instead of only providing tax filings or financial statements, firms can deliver ongoing performance insights through interactive dashboard systems.
This not only builds trust but also creates new revenue streams through advisory services, budgeting support, and business consulting. A well-designed dashboard example might show client profitability trends, budget variance analysis, or industry benchmarking KPIs.
Automated dashboard systems reduce reliance on manual data entry and spreadsheet formulas, both of which are prone to human error. Integrating source systems ensures data accuracy and consistency in key performance indicators, particularly when used across teams or locations.
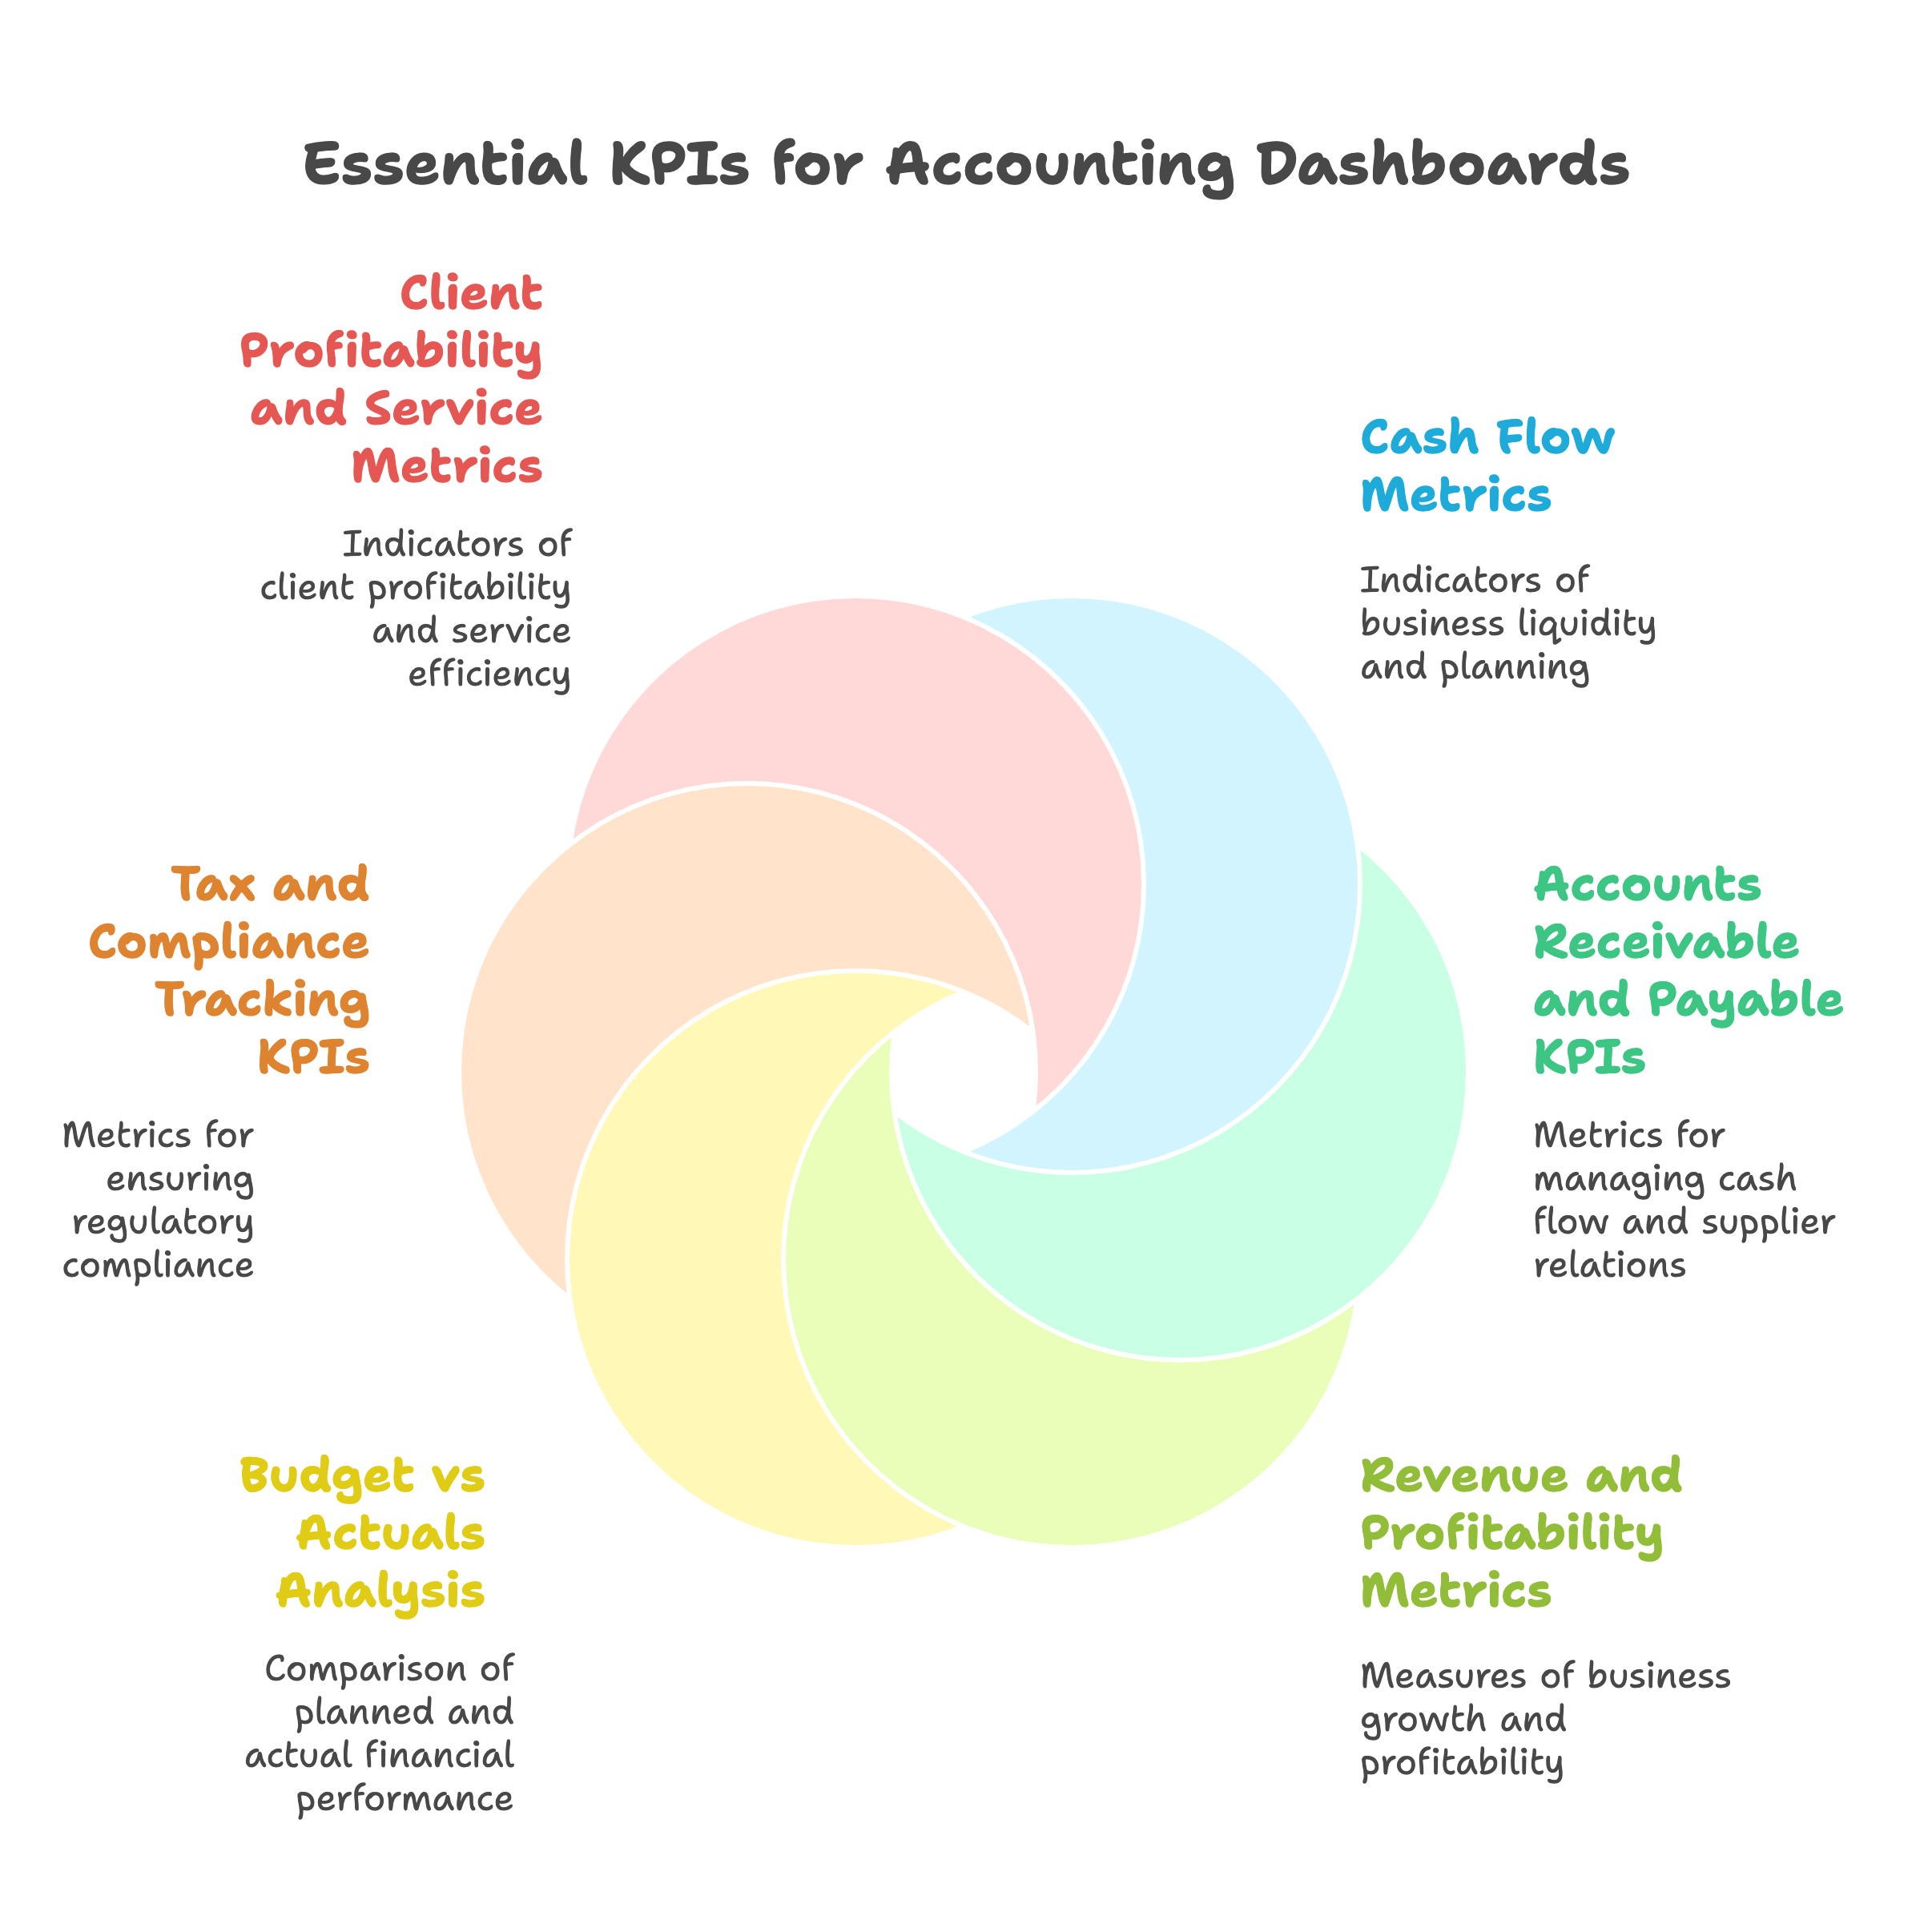
The value of any business intelligence dashboard depends on the quality and relevance of its metrics. While every business may have slightly different needs, the following KPIs are essential for financial clarity and should be included in most dashboard examples.
Cash flow is the lifeblood of any business. A financial dashboard should display these critical cash flow metrics:
These KPIs help detect liquidity issues early and support more accurate planning through dashboard visualization of cash patterns.
Tracking AR and AP in real-time through dashboard systems supports better cash management. Useful metrics include:
These insights help prioritize collections and payment strategies through clear dashboard visualization.
Understanding top-line growth and bottom-line profitability is crucial for any financial dashboard. Key performance indicators should include:
Visualizing these data points helps spot underperforming services or clients through effective dashboard design.
Tracking budget adherence keeps spending in check and ensures alignment with strategic goals. Dashboard systems should highlight:
This enables mid-course corrections before budget overruns become serious problems, making it a critical component of any business intelligence dashboard.
CPA firms benefit from metrics that support compliance monitoring in their dashboard solutions. These might include:
This reduces the risk of missed filings or penalties through proactive dashboard monitoring.
For firms managing multiple clients, business intelligence dashboards can help identify which clients are most profitable by comparing:
This supports better resource allocation and pricing strategies through data-driven dashboard insights.
Even the best data is useless without effective presentation. A well-designed business intelligence dashboard is clean, focused, and actionable. Effective dashboard design principles ensure that key performance indicators are clearly communicated through appropriate visualization.
Start by asking what decisions the dashboard should support. For example:
The purpose will shape what data points you include and how you structure the dashboard design.
Different metrics call for different chart types in your business intelligence dashboard. Use:
Avoid clutter and only show the charts and graphs that support decision-making and highlight important KPIs.
Dashboard systems are only as reliable as the real-time data behind them. Use automated data pipelines to ensure regular updates and data integrity. Reconcile source systems like QuickBooks, payroll software, and bank feeds to avoid inconsistencies in your key performance indicators.
Organize the business intelligence dashboard into logical sections such as:
This makes it easier for users to find relevant information quickly within the dashboard interface.
Interactivity enhances utility in any business intelligence tool. Let users filter by date range, department, or client. Allow them to drill down into invoices or transactions behind summary figures in the dashboard.
This is especially useful for accountants and CFOs who need to investigate anomalies or understand the details behind high-level KPIs.
Several platforms support business intelligence dashboard creation. The best choice depends on your tech stack, client needs, and budget for dashboard solutions.
Power BI is a powerful, flexible business intelligence tool for mid-sized CPA firms. It connects easily to Excel, SQL databases, and cloud accounting software. This business intelligence dashboard platform supports drill-downs, automation, and client portals with sophisticated data visualization capabilities.
Dashboard Example Applications:
Tableau offers advanced visualization features and is ideal for firms with complex data analysis needs. This business intelligence tool supports both on-premise and cloud deployment for comprehensive dashboard solutions.
Key Features:
Klipfolio is user-friendly and integrates well with cloud-based accounting platforms. This business intelligence dashboard solution is suitable for small businesses and startup clients who need simple but effective dashboard systems.
Benefits:
Free and accessible, Google Data Studio works well for firms already using Google Sheets and Google Analytics. This business intelligence tool is ideal for basic dashboarding and low-budget dashboard projects.
Advantages:
Roll out business intelligence dashboards for one client or department before expanding. This helps refine your data sources, dashboard design, and key performance indicators before full deployment.
Pilot Dashboard Example:
Instead of only using business intelligence dashboards internally, offer them to clients as part of advisory packages. This adds value and differentiates your firm through advanced dashboard visualization services.
Service Offerings:
Ensure both internal teams and client stakeholders know how to use the business intelligence dashboard effectively. Provide simple training sessions or quick reference guides for interpreting key performance indicators.
Training Components:
Review dashboard performance regularly through usage analytics and user feedback. Are the KPIs being used effectively? Are clients finding value in the dashboard visualization? Use feedback to refine the content and functionality.
Continuous Improvement Areas:
Modern business intelligence dashboards can integrate real-time data from multiple sources, providing up-to-the-minute insights into key performance indicators. This capability transforms how accountants monitor business performance and respond to changing conditions.
Real-Time Data Sources:
Advanced dashboard systems can incorporate predictive analytics to forecast future performance based on historical data points and trend analysis. This adds significant value to business intelligence dashboards by enabling proactive decision-making.
Predictive KPIs:
Modern business intelligence tools offer mobile-responsive dashboard design, allowing users to access critical KPIs and real-time data from anywhere. This mobility enhances the value of dashboard solutions for busy executives and field-based teams.
Smart business intelligence dashboards can send automated alerts when key performance indicators exceed predefined thresholds or when critical data points require attention.
Alert Examples:
A dashboard example for consulting or legal firms might focus on:
Manufacturing business intelligence dashboards typically emphasize:
Retail-focused dashboard solutions often highlight:
Track how frequently users access the business intelligence dashboard and which KPIs receive the most attention. High engagement indicates successful dashboard design and valuable metrics selection.
Measure how dashboard insights influence business decisions and improve business performance. Track instances where real-time data from the dashboard led to actionable changes in strategy or operations.
Calculate the time saved by using automated dashboard systems instead of manual report generation. This includes time spent on data gathering, analysis, and presentation of key performance indicators.
For CPA firms offering dashboard solutions as a service, monitor client satisfaction scores and retention rates. Successful business intelligence dashboards should enhance client relationships and increase service value.
Next-generation business intelligence tools will incorporate AI to automatically identify patterns, anomalies, and insights in financial data points. This will enhance the predictive capabilities of dashboard systems.
Future dashboard solutions may allow users to query data using natural language, making it easier to extract insights from complex KPIs without technical expertise.
Emerging visualization technologies will provide new ways to display data points and key performance indicators, making complex financial information more accessible and actionable.
Advanced business intelligence dashboards will offer more automated insights and recommendations, reducing the manual effort required to interpret data and identify action items.
Business intelligence dashboards have become essential tools for modern accounting operations. They bring clarity, speed, and precision to financial decision-making, helping CPA firms and their clients stay competitive in a fast-moving market through effective visualization of key performance indicators.
By implementing the right KPIs, choosing appropriate business intelligence tools, and following effective dashboard design principles, accounting professionals can shift from reactive reporting to proactive advisory services. Whether tracking cash flow metrics, monitoring client profitability indicators, or staying ahead of tax deadlines, business intelligence dashboards turn complex data points into real-time strategy.
A well-designed financial dashboard serves as more than just a reporting mechanism—it becomes a strategic asset that enhances business performance monitoring and drives better decision-making. The integration of real-time data, interactive visualization, and automated alerts creates a powerful business intelligence tool that transforms how accounting professionals serve their clients.
The key to successful dashboard implementation lies in starting with clear objectives, selecting relevant KPIs, and designing intuitive visualization that makes complex financial information accessible to all stakeholders. Whether you're implementing a simple cash flow dashboard or a comprehensive business intelligence dashboard system, the focus should remain on delivering actionable insights that drive improved business performance.
At Madras Accountancy, we help CPA firms build, maintain, and scale their business intelligence dashboard solutions with the support of our offshore accounting team. From data integration to dashboard design, we help you transform client data into advisory insights that drive growth and enhance the value of your professional services through sophisticated but user-friendly dashboard systems.
Question: What are business intelligence dashboards and how do they benefit accounting functions?
Answer: Business intelligence dashboards are visual displays of key financial metrics, KPIs, and performance indicators that provide real-time insights into business performance through charts, graphs, and interactive visualizations. For accounting functions, dashboards benefit organizations by enabling real-time financial monitoring, improving decision-making speed, identifying trends and anomalies quickly, and providing executive-level visibility into financial performance. They automate reporting processes, reduce manual data compilation time, and ensure stakeholders have current information for strategic planning. Dashboards also improve accuracy by eliminating manual report preparation errors and enable drill-down capabilities for detailed analysis of summarized metrics.
Question: What key financial metrics should be included in accounting business intelligence dashboards?
Answer: Essential financial metrics for accounting dashboards include cash flow trends, accounts receivable aging, profit and loss performance, budget versus actual variances, and working capital indicators. Key metrics cover revenue trends, gross and net profit margins, expense category analysis, days sales outstanding, inventory turnover, and debt-to-equity ratios. Additional important indicators include collection rates, bad debt percentages, cost per transaction, and operational efficiency measures. Dashboard metrics should align with business objectives, stakeholder needs, and industry benchmarks. Consider both high-level summary metrics for executives and detailed operational metrics for department managers. Real-time metrics enable proactive management while trend analysis supports strategic planning and performance improvement initiatives.
Question: How should accounting teams design effective dashboard layouts and visualizations?
Answer: Design effective accounting dashboards by prioritizing most important metrics prominently, using appropriate chart types for different data types, maintaining consistent color schemes and formatting, and ensuring mobile accessibility for remote access. Group related metrics logically, use clear labels and descriptions, and implement drill-down capabilities for detailed analysis. Choose visualizations that quickly communicate key insights - use line charts for trends, bar charts for comparisons, and gauges for performance against targets. Avoid cluttered layouts, excessive colors, or complex visualizations that obscure rather than clarify information. Test dashboards with actual users, gather feedback for improvements, and iterate designs based on usage patterns and changing business needs.
Question: What data sources should be integrated into accounting business intelligence dashboards?
Answer: Integrate multiple data sources into accounting dashboards including ERP systems, accounting software, CRM systems, bank feeds, payroll systems, and external market data for comprehensive financial visibility. Common sources include QuickBooks, NetSuite, Salesforce, Excel spreadsheets, and industry databases. API integrations enable real-time data updates while maintaining data accuracy and consistency. Consider data quality, update frequencies, and integration complexity when selecting sources. Implement data validation procedures, establish refresh schedules, and maintain data governance standards. Cloud-based integration platforms often simplify multi-source connectivity while providing scalability for growing data requirements. Professional assistance may be needed for complex integrations or custom data source connections.
Question: How can accounting dashboards improve financial reporting and compliance processes?
Answer: Accounting dashboards improve financial reporting by automating report generation, ensuring data consistency across reports, providing real-time compliance monitoring, and reducing manual report preparation time. Dashboards enable continuous monitoring of key compliance metrics, early identification of potential issues, and automated alerts for metrics exceeding acceptable ranges. They support audit preparations by providing detailed audit trails, historical trend analysis, and supporting documentation for financial statement items. Standardized dashboard formats ensure consistent reporting across periods and departments while reducing errors from manual compilation. Integration with accounting systems ensures report accuracy and enables rapid response to stakeholder information requests throughout reporting cycles.
Question: What are the implementation challenges and best practices for accounting dashboard projects?
Answer: Implementation challenges for accounting dashboards include data quality issues, integration complexity, user adoption resistance, and ongoing maintenance requirements. Address challenges through comprehensive planning, stakeholder involvement, pilot implementations, and adequate training programs. Best practices include starting with core metrics before expanding scope, ensuring data accuracy before visualization, providing comprehensive user training, and establishing governance procedures for dashboard maintenance. Involve end users in design processes, establish clear objectives and success metrics, and plan for ongoing support and updates. Change management is crucial for user adoption - communicate benefits clearly, provide adequate training, and gather feedback for continuous improvement. Professional project management helps ensure successful implementations within budget and timeline constraints.
Question: How should businesses measure ROI and success of accounting dashboard implementations?
Answer: Measure accounting dashboard ROI through time savings from automated reporting, improved decision-making speed, reduced errors in financial processes, and enhanced compliance efficiency. Track metrics including report preparation time reductions, faster month-end closing cycles, improved forecast accuracy, and increased stakeholder satisfaction with financial information access. Calculate cost savings from reduced manual processes, improved cash flow management, and earlier identification of financial issues. Measure user adoption rates, dashboard usage frequency, and business process improvements enabled by better visibility. Survey stakeholders about information quality improvements and decision-making enhancements. Consider both quantitative benefits (time and cost savings) and qualitative improvements (better insights, improved collaboration) when evaluating overall dashboard value and return on investment.
Question: What future trends are shaping business intelligence dashboards for accounting?
Answer: Future trends in accounting business intelligence include artificial intelligence for predictive analytics, machine learning for anomaly detection, real-time streaming data integration, and mobile-first dashboard designs. AI enables automated insights generation, predictive forecasting, and intelligent alerting for potential issues. Natural language processing allows query-based dashboard interaction and automated narrative generation for financial results. Cloud-native platforms provide scalability and accessibility advantages while reducing IT infrastructure requirements. Integration with emerging technologies like blockchain for transaction verification and IoT devices for operational data collection expands dashboard capabilities. These trends enable more sophisticated analysis, improved user experiences, and enhanced decision-making support for accounting teams and business stakeholders.
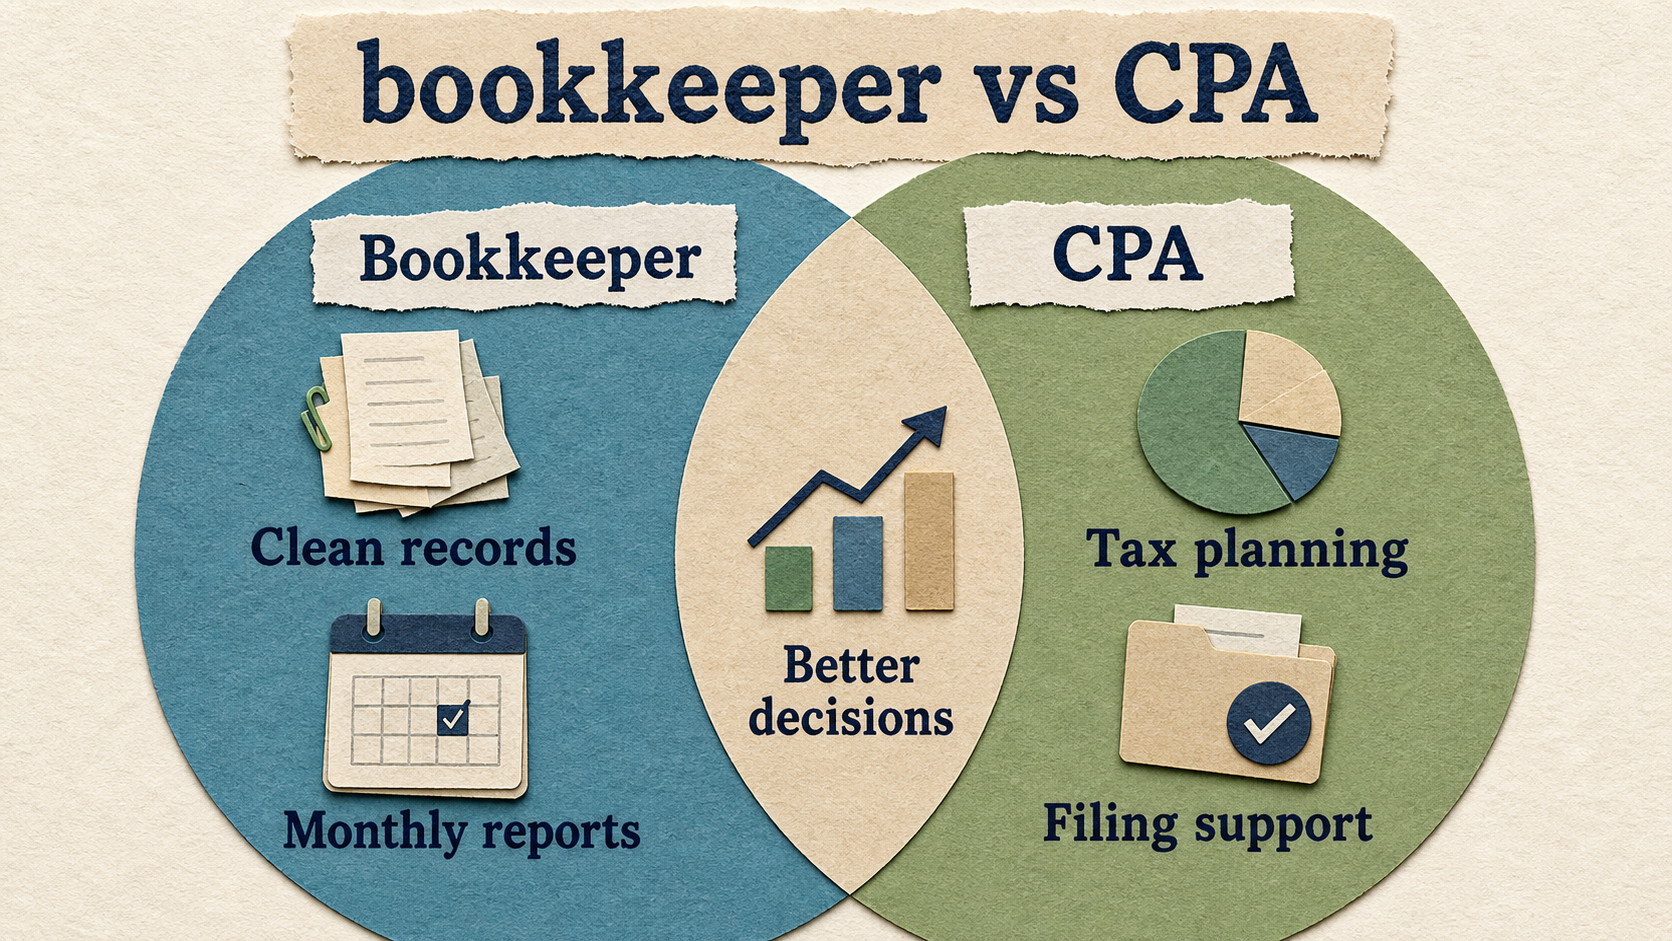
Compare a bookkeeper and CPA so your business knows when it needs recordkeeping, tax filing, planning, or higher-level advice.
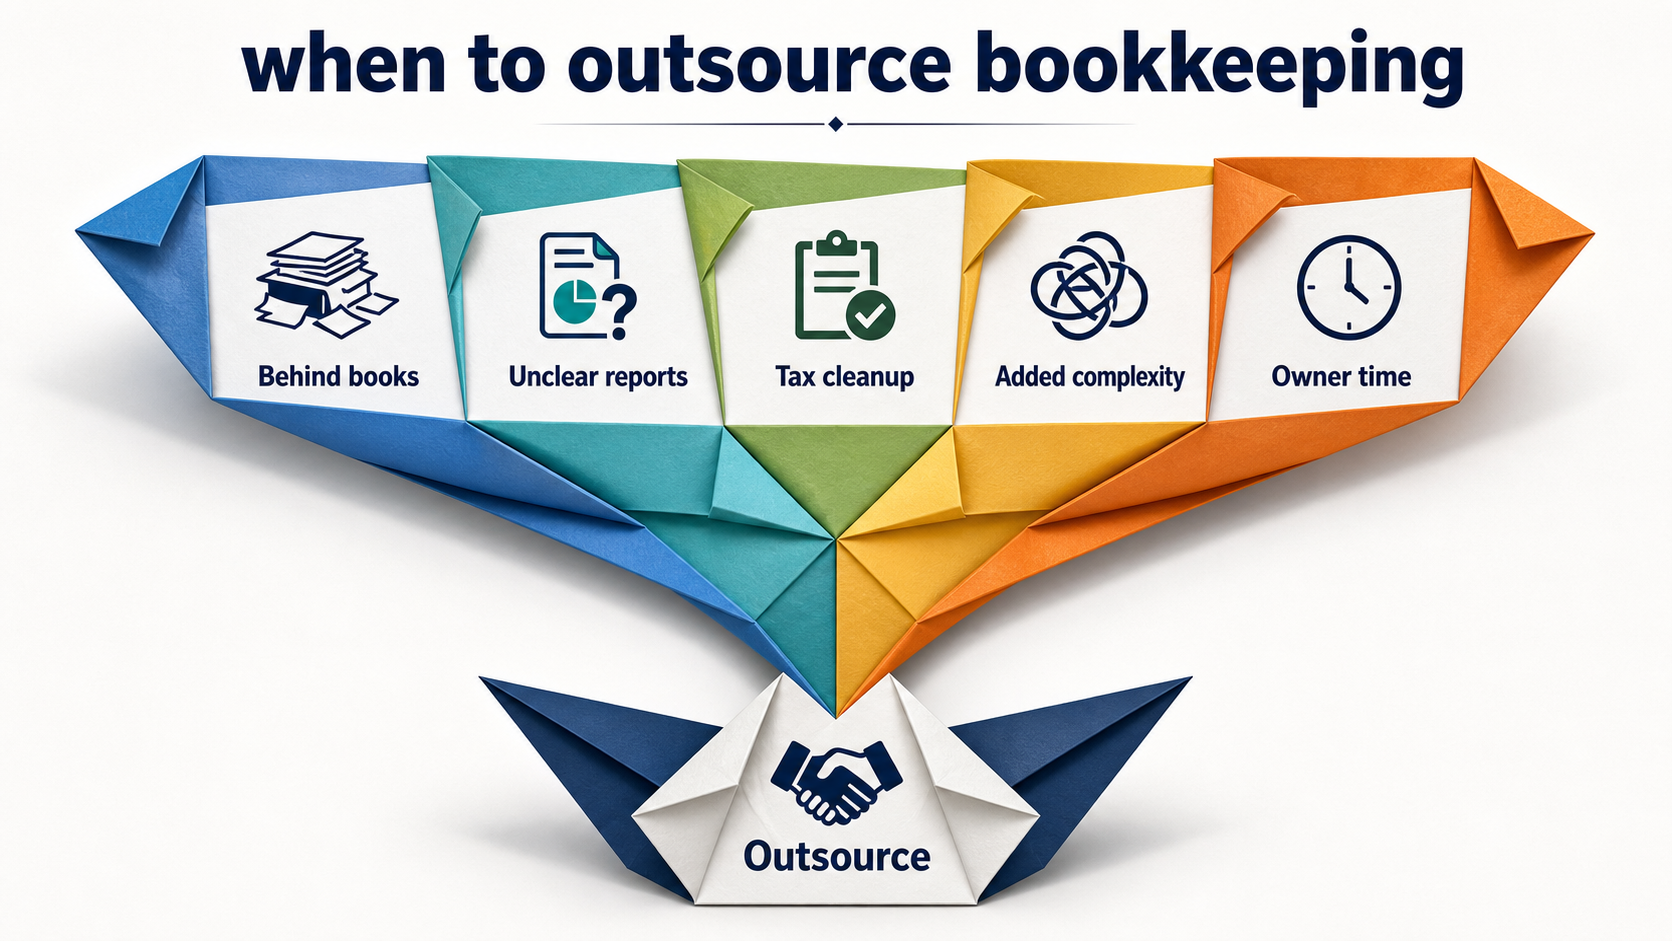
Learn when to outsource bookkeeping, what tasks to hand off first, and how outsourced bookkeeping supports tax planning and decisions.

Use this ecommerce sales tax checklist to review nexus, registrations, marketplaces, product taxability, filings, and bookkeeping records.