ESG reporting shares how your business affects the environment, people, and governance. It covers energy use, waste, safety, pay and diversity, ethics, and risk controls. The aim is clear: help customers, lenders, and staff understand how you operate and how you plan to improve. For a small or medium business, the report should be short, plain, and tied to real actions.
ESG helps you win and keep customers that ask for supplier data. It can lower loan costs when banks review risk. It can also reduce waste and rework inside the company. Clear goals rally teams. A simple report shows that you track the right things and fix problems when they appear.
A small team cannot track everything. Start with a narrow scope and expand slowly. Choose a base year. Decide which sites, products, and contractors are in the first version. Explain any limits so readers know what is included. A tight scope creates a report you can repeat every year.
You do not need a long manual to start. Pick a recognized structure so terms are clear. Match the choice to your audience. Customers often ask for focused industry topics. Investors prefer consistent metrics across firms. Keep the framework stable for two or three years so trends are easy to read. If rules change later, say what changed and why.
Materiality is the filter. Ask which topics could change revenue, cost, or risk in a real way. Ask customers and staff what they expect from you. Put the answers in a short table with high, medium, and low priority topics. Report on the high items now. Keep the medium items in view for next year. This keeps the report simple and useful.
A good data model lists the metric name, the unit, the source system, the owner, and the check you run each time. Store this list in one file. Use the same names and units every period. Lock a monthly or quarterly pull from each source. Save extracts with dates. Consistency prevents long hunts at year end.
Start with fuel and electricity use. Use bills, meter reads, or utility portals. Convert to emissions using a simple method and write the method down. Show the total, then show intensity per unit of output if it helps your readers.
Track water from bills or meters. Track waste from hauler receipts. If you do not have full detail at first, say so and improve next year. Show actions you take to reduce use and increase recycling.
Show headcount, voluntary turnover, and training hours. If safety is relevant, show recordable incidents and steps taken to reduce them. Keep privacy in mind and avoid sharing sensitive data.
Explain your approach to fair pay, benefits, and flexible work. If you report diversity data, define the categories you use and how you measure them. Add a short plan to improve hiring and growth access.
Explain your code of conduct and how staff report concerns. Show who oversees risk. Describe how you review vendors for quality and security. State how often leaders review key risks and controls.
If you handle customer data, say how you protect it. Explain access rules, training, and how you test systems. Do not publish details that would create risk. Keep it high level and practical.
Pick a few targets you can hit and measure. Use a base line from last year. Set a one year target and a three year target. Keep targets clear, such as a percent cut in energy use per unit of output or a set number of training hours per person. Explain who owns each target. Review results every quarter and update plans when needed.
Name one ESG lead. Give data owners by topic. For example, operations owns energy and waste, HR owns people data, IT owns security metrics, and finance owns controls. Name one reviewer who checks math and claims before you publish.
Run a short cadence. Pull data monthly or quarterly. Keep the same day for pulls. Check totals against prior periods and explain large shifts. Save screenshots and exports in a dated folder. A steady rhythm turns reporting into routine work.
You can start with your ledger, HR system, and utility portals. Store data in a shared drive or a simple database. Add a dashboard later if you need it. Keep formats simple. CSV exports and a master spreadsheet are fine for a first year if your checks are clear and files are in order.
Use short sections and clear headers. Aim for ten to fifteen pages for the first version. Start with a summary of three to five highlights and one or two gaps you plan to fix. Then cover environmental, social, and governance sections. End with a glossary of terms you use.
Explain your methods. If you estimate a number, say how and why. If the scope excludes a site or a product, state it. If survey data has a low response rate, say so and describe how you will improve it. Readers trust clear limits.
Post a PDF on your site and add a web page with the main charts. Share the report with customers who ask for supplier data. Publish once a year on the same month. If you update a number after release, note the change and the reason.
Invite feedback with a single email address. Review questions and add common answers to the next version. Keep a change log from year to year so readers see progress.
Before release, run an internal review with finance and legal. Ask a manager not tied to the data to trace a few metrics back to source files. If key customers require assurance, start with a limited review by an independent firm. Share their scope and conclusion in the report. As your program grows, increase the level of assurance.
ESG is not only about scores. It is also about risk. Use the process to lower waste, cut energy peaks, and reduce safety incidents. Use vendor reviews to avoid supply problems. Tie goals to budgets so actions are funded. Small steps, done often, beat large plans that never ship.
Pick scope, framework, and metrics. Build the data model. Pull base year data. Set targets and owners. Draft the report layout.
Run monthly or quarterly pulls. Test checks and fix gaps. Share early results with leaders. Adjust targets if needed.
Write the report. Run reviews. Prepare the web page. Publish on time. Collect feedback and log ideas for next year.
A long list confuses readers and drains time. Focus on the few items that drive cost, risk, or customer trust. Add more only when the process is stable.
Numbers without actions lose value. Tie each target to a project, an owner, and a date. Report progress in the next cycle.
Changing units or sources makes trends unclear. Lock methods for a period and note any change at the start of a new year.
Claims need files. Save exports, receipts, or screenshots with dates. Use clear file names and a single folder tree so others can trace numbers.
Track electricity, gas, and scrap rates. Show plans to reduce machine idle time and improve maintenance. Connect savings to lower cost per unit.
Track travel miles, remote work policies, training hours, and volunteer time. Explain data security training and client data safeguards.
Track packaging use, return rates, and last mile emissions estimates. Show your product safety checks and fair labor standards for vendors. Describe customer privacy rules.
Add more detail after the first cycle. Expand scope to more sites. Add supplier checks for high risk categories. Improve data quality with direct meter reads or system links. Consider a short survey for staff engagement. Publish a short midyear update if something major changes.
ESG reporting for small and medium businesses should be simple, honest, and repeatable. Start with a clear scope and a few material topics. Build a small data model with named owners and steady checks. Set targets that match your size and budget. Write in plain language and explain limits. Publish on time each year and improve a little each cycle. With this approach, your report becomes a tool for better operations, lower risk, and stronger trust with the people who rely on your business.

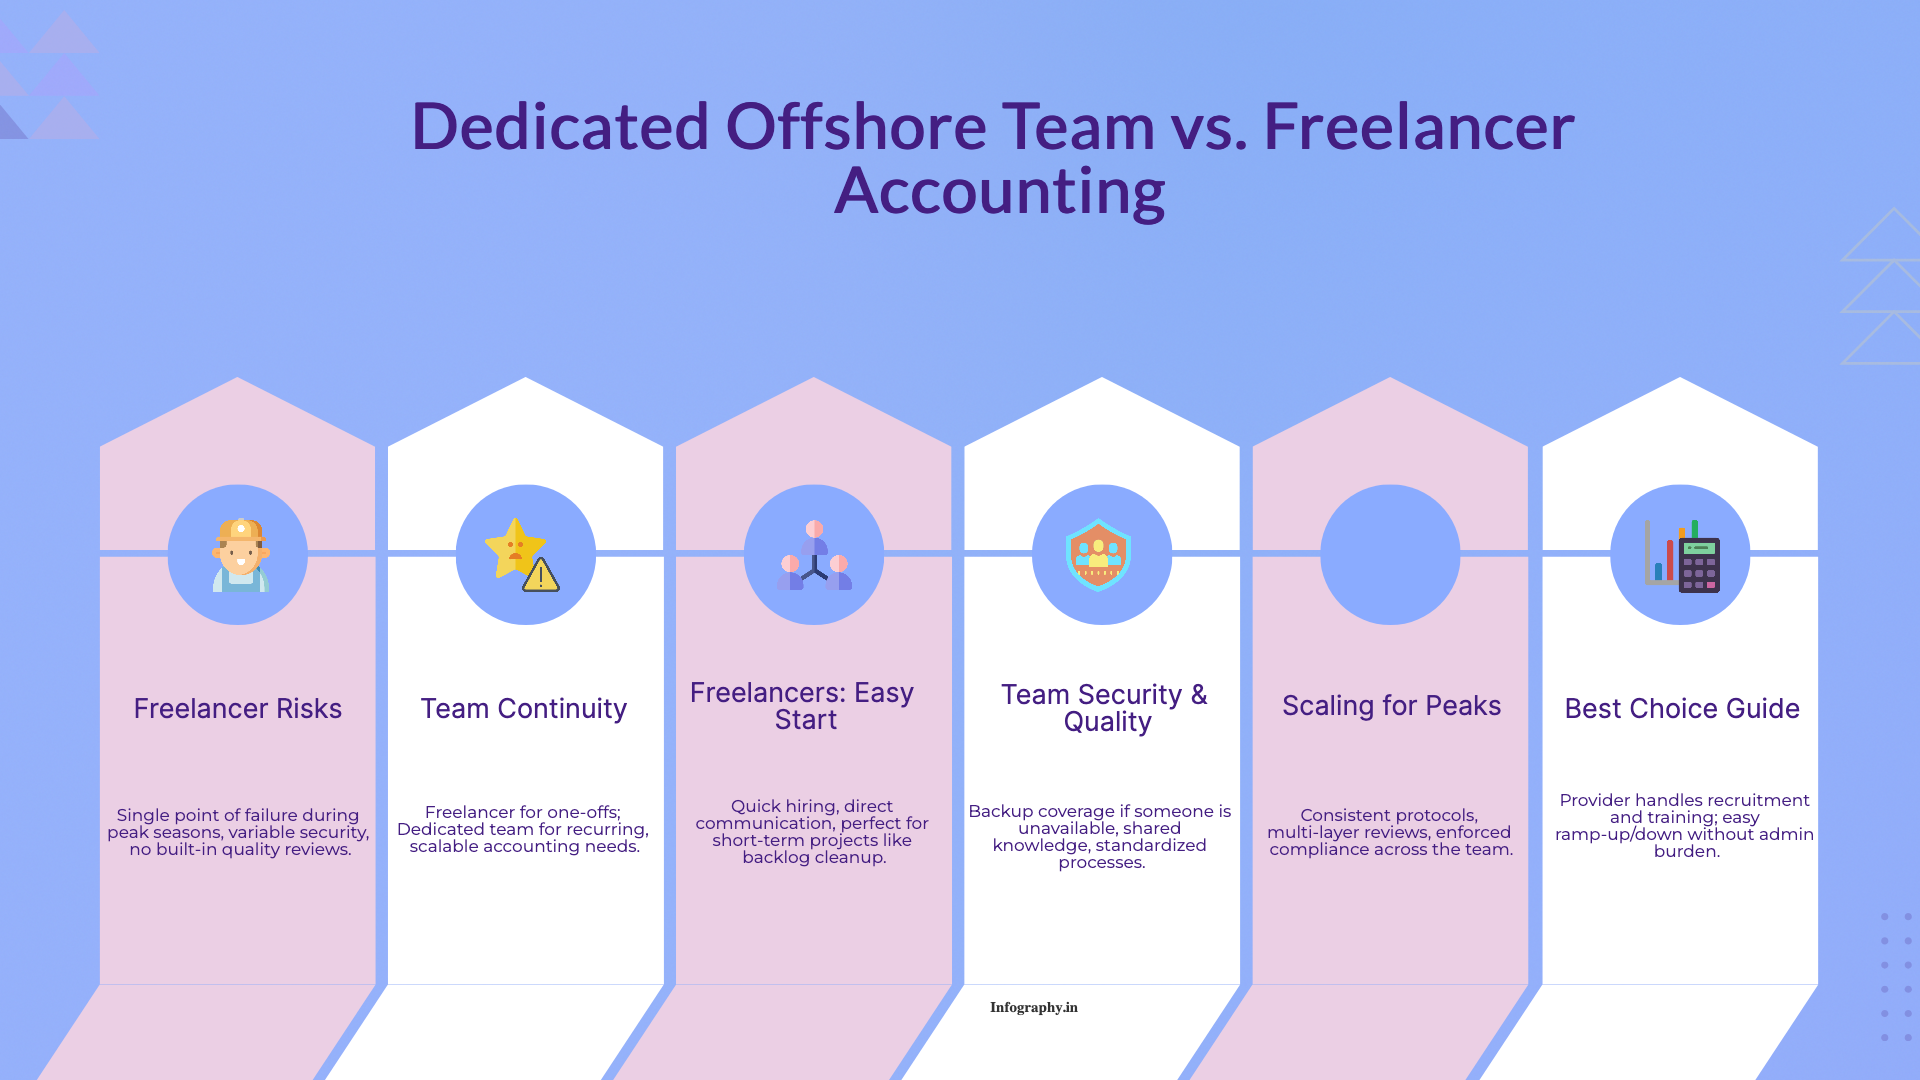
A practical comparison of hiring a freelancer vs using a dedicated offshore accounting team, focusing on continuity, quality control, security, and scaling.

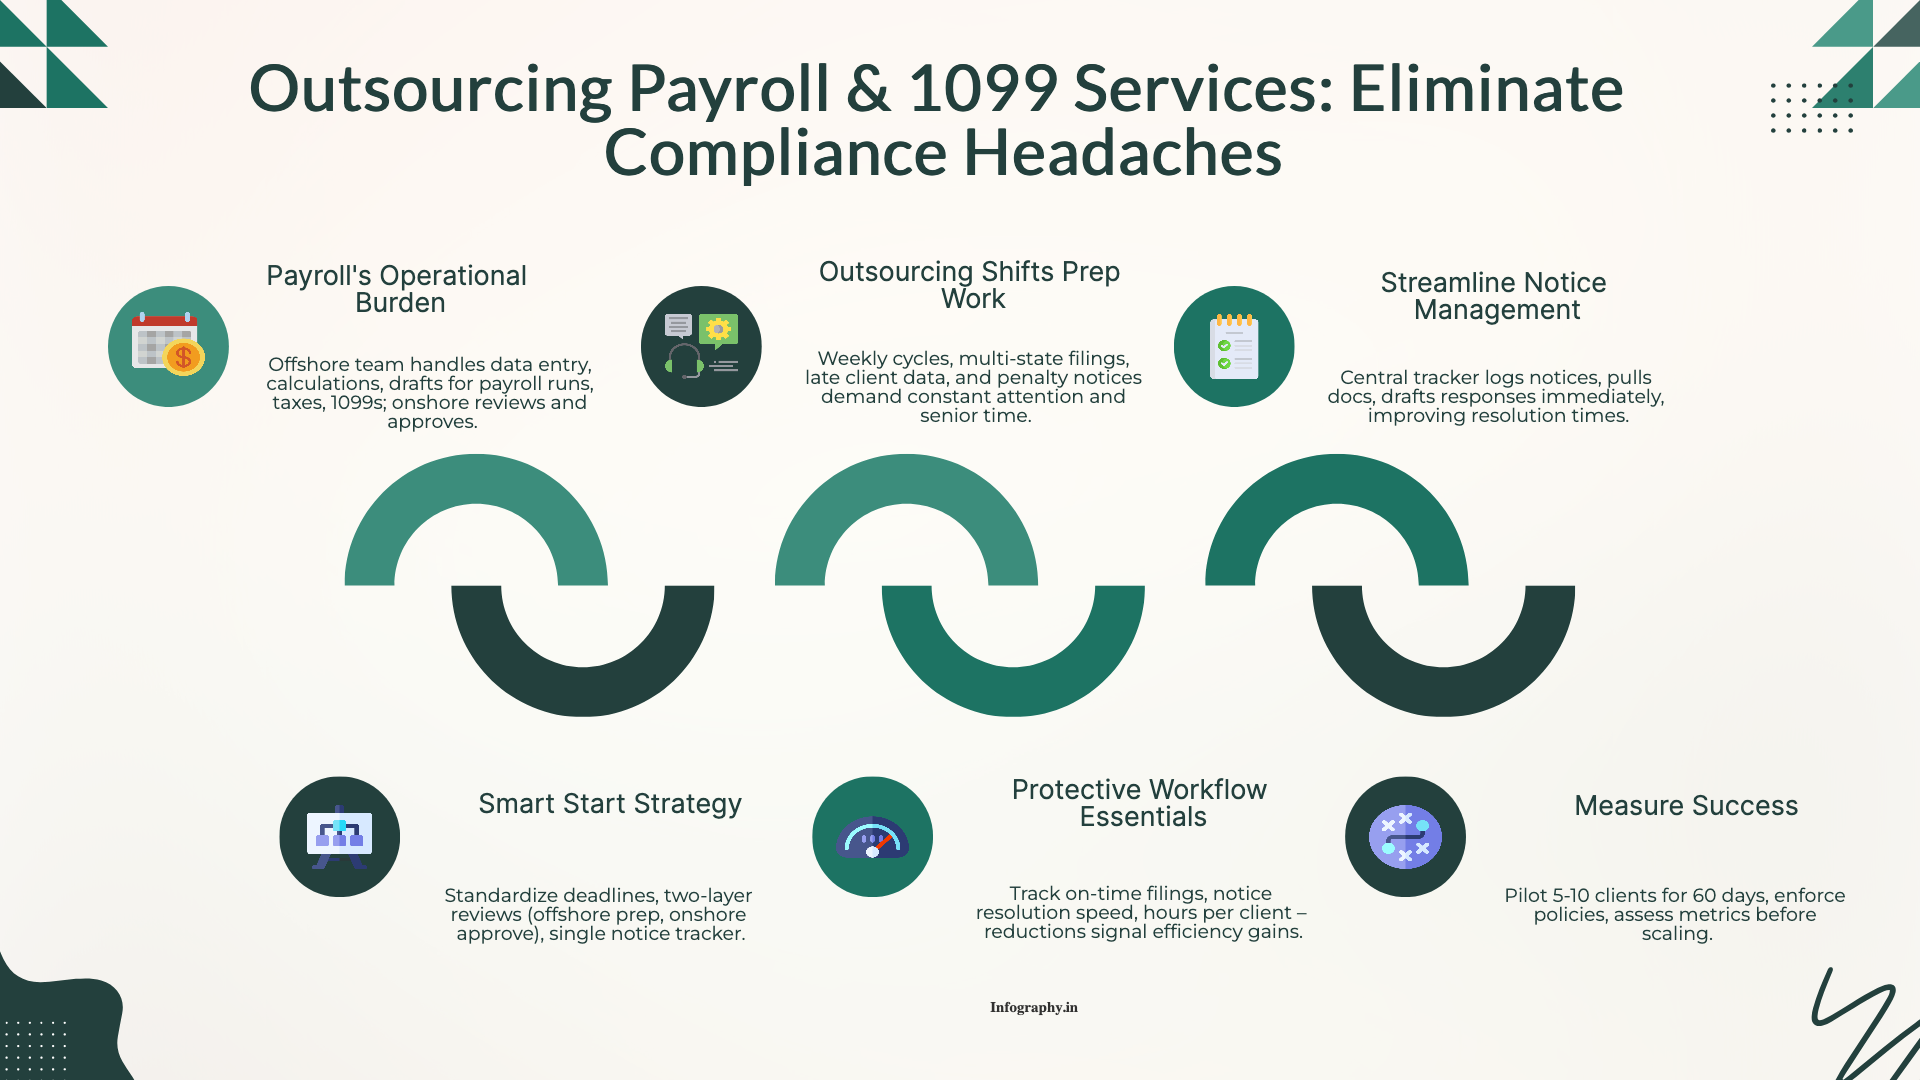
How CPA firms outsource payroll and 1099 work to reduce penalties and admin load, with a clean workflow for approvals, filings, and year-end reporting.

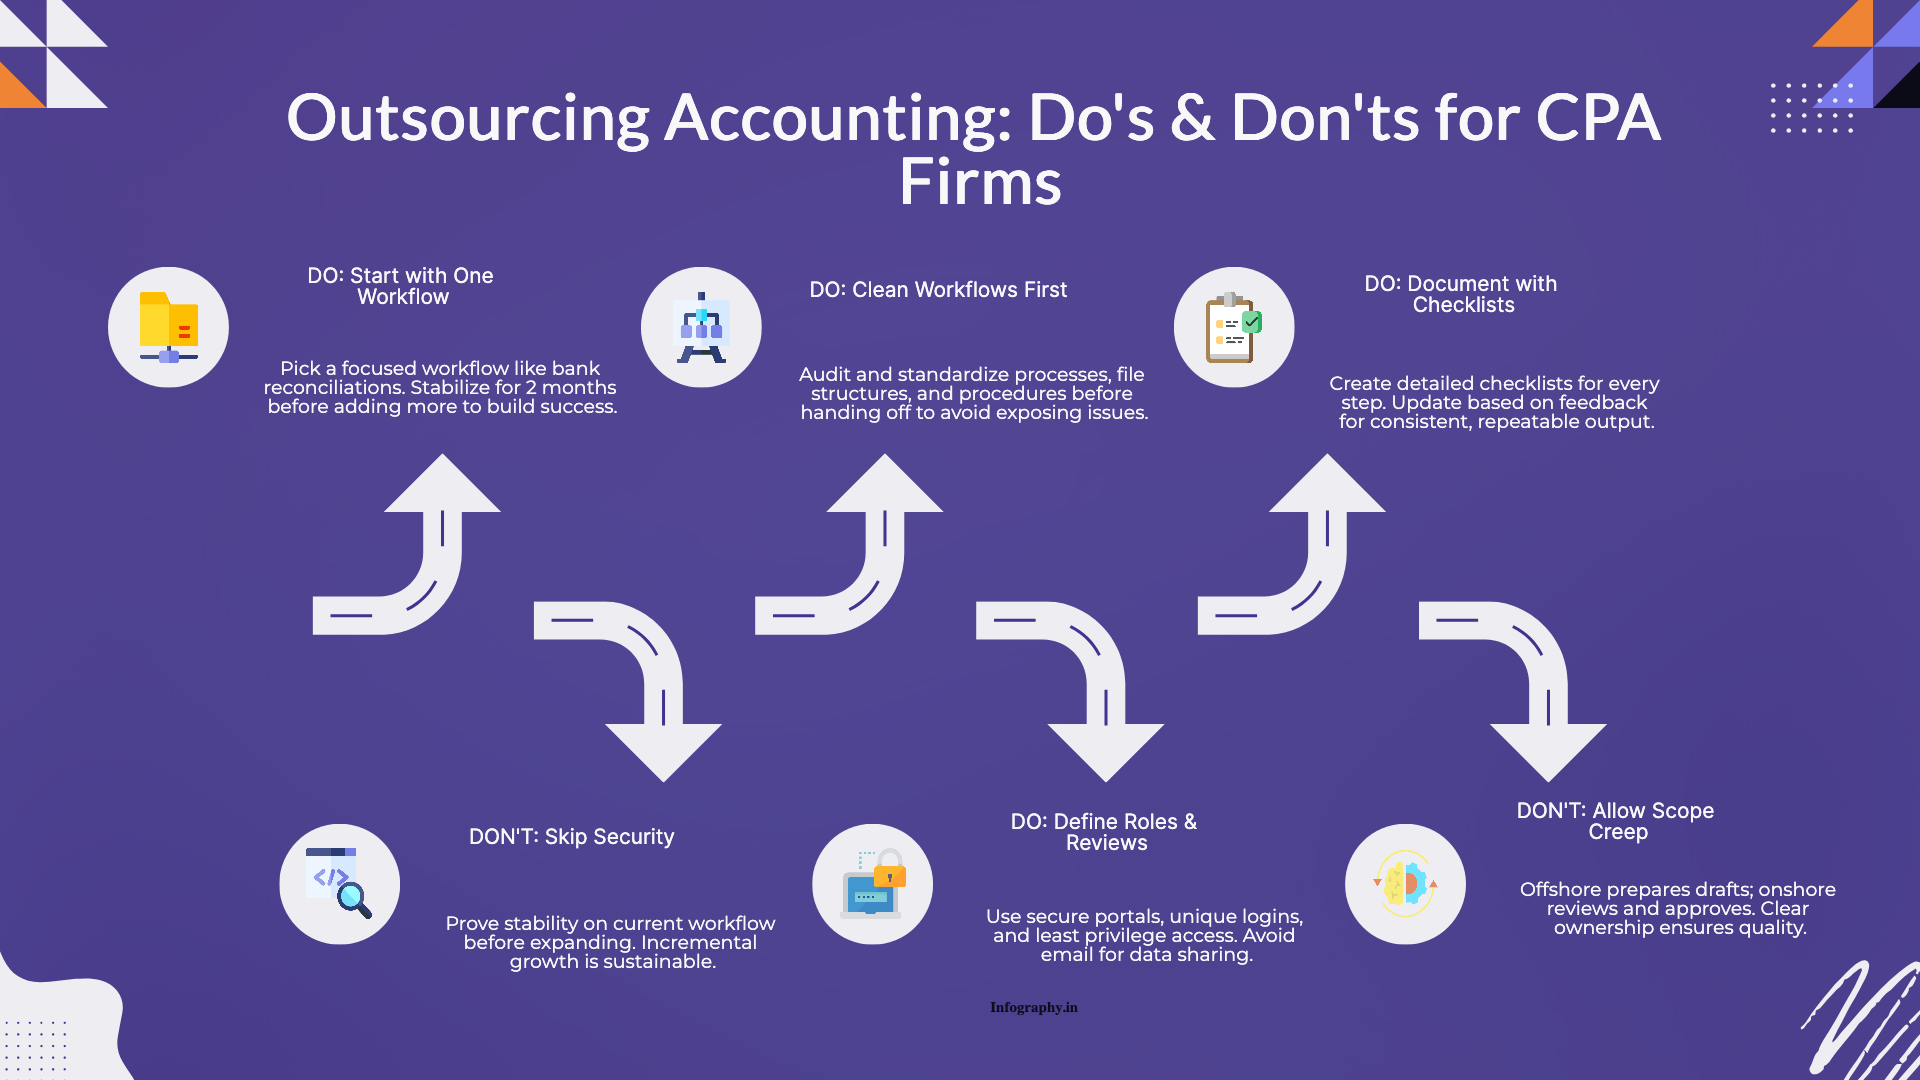
Practical do's and don'ts for CPA firms outsourcing accounting work, based on common failure points and what successful rollouts do differently.