.png)

Key performance indicators, or KPIs, serve as the financial compass of every small business. For small business operations that function with lean teams, limited resources, and high pressure to grow or stay afloat, tracking the right financial KPIs is more than helpful—it is essential for effective financial management and achieving business goals.
Too often, business owners focus solely on revenue or net profit while ignoring the financial metrics that actually signal long-term sustainability. Cash flow patterns, working capital ratios, gross profit margins, and other critical KPIs paint a clearer picture of whether a small business is thriving or heading for trouble.
Understanding which KPIs to track and how to interpret these financial metrics enables better business strategy development and more informed decision-making. Each KPI serves as a key performance indicator that reveals different aspects of financial performance and operational efficiency.
At Madras Accountancy, we help small and mid-sized CPA firms give their clients this clarity through data-backed insights, reliable financial reporting, and offshore support. When CPA firms can deliver consistent KPI tracking and analysis, their clients make better decisions, stay compliant, and grow more confidently while achieving their business objectives.
This article provides a detailed look at the most critical financial KPIs for small business operations. For each metric, we explain what it is, how to calculate it, and why it matters for overall financial performance.
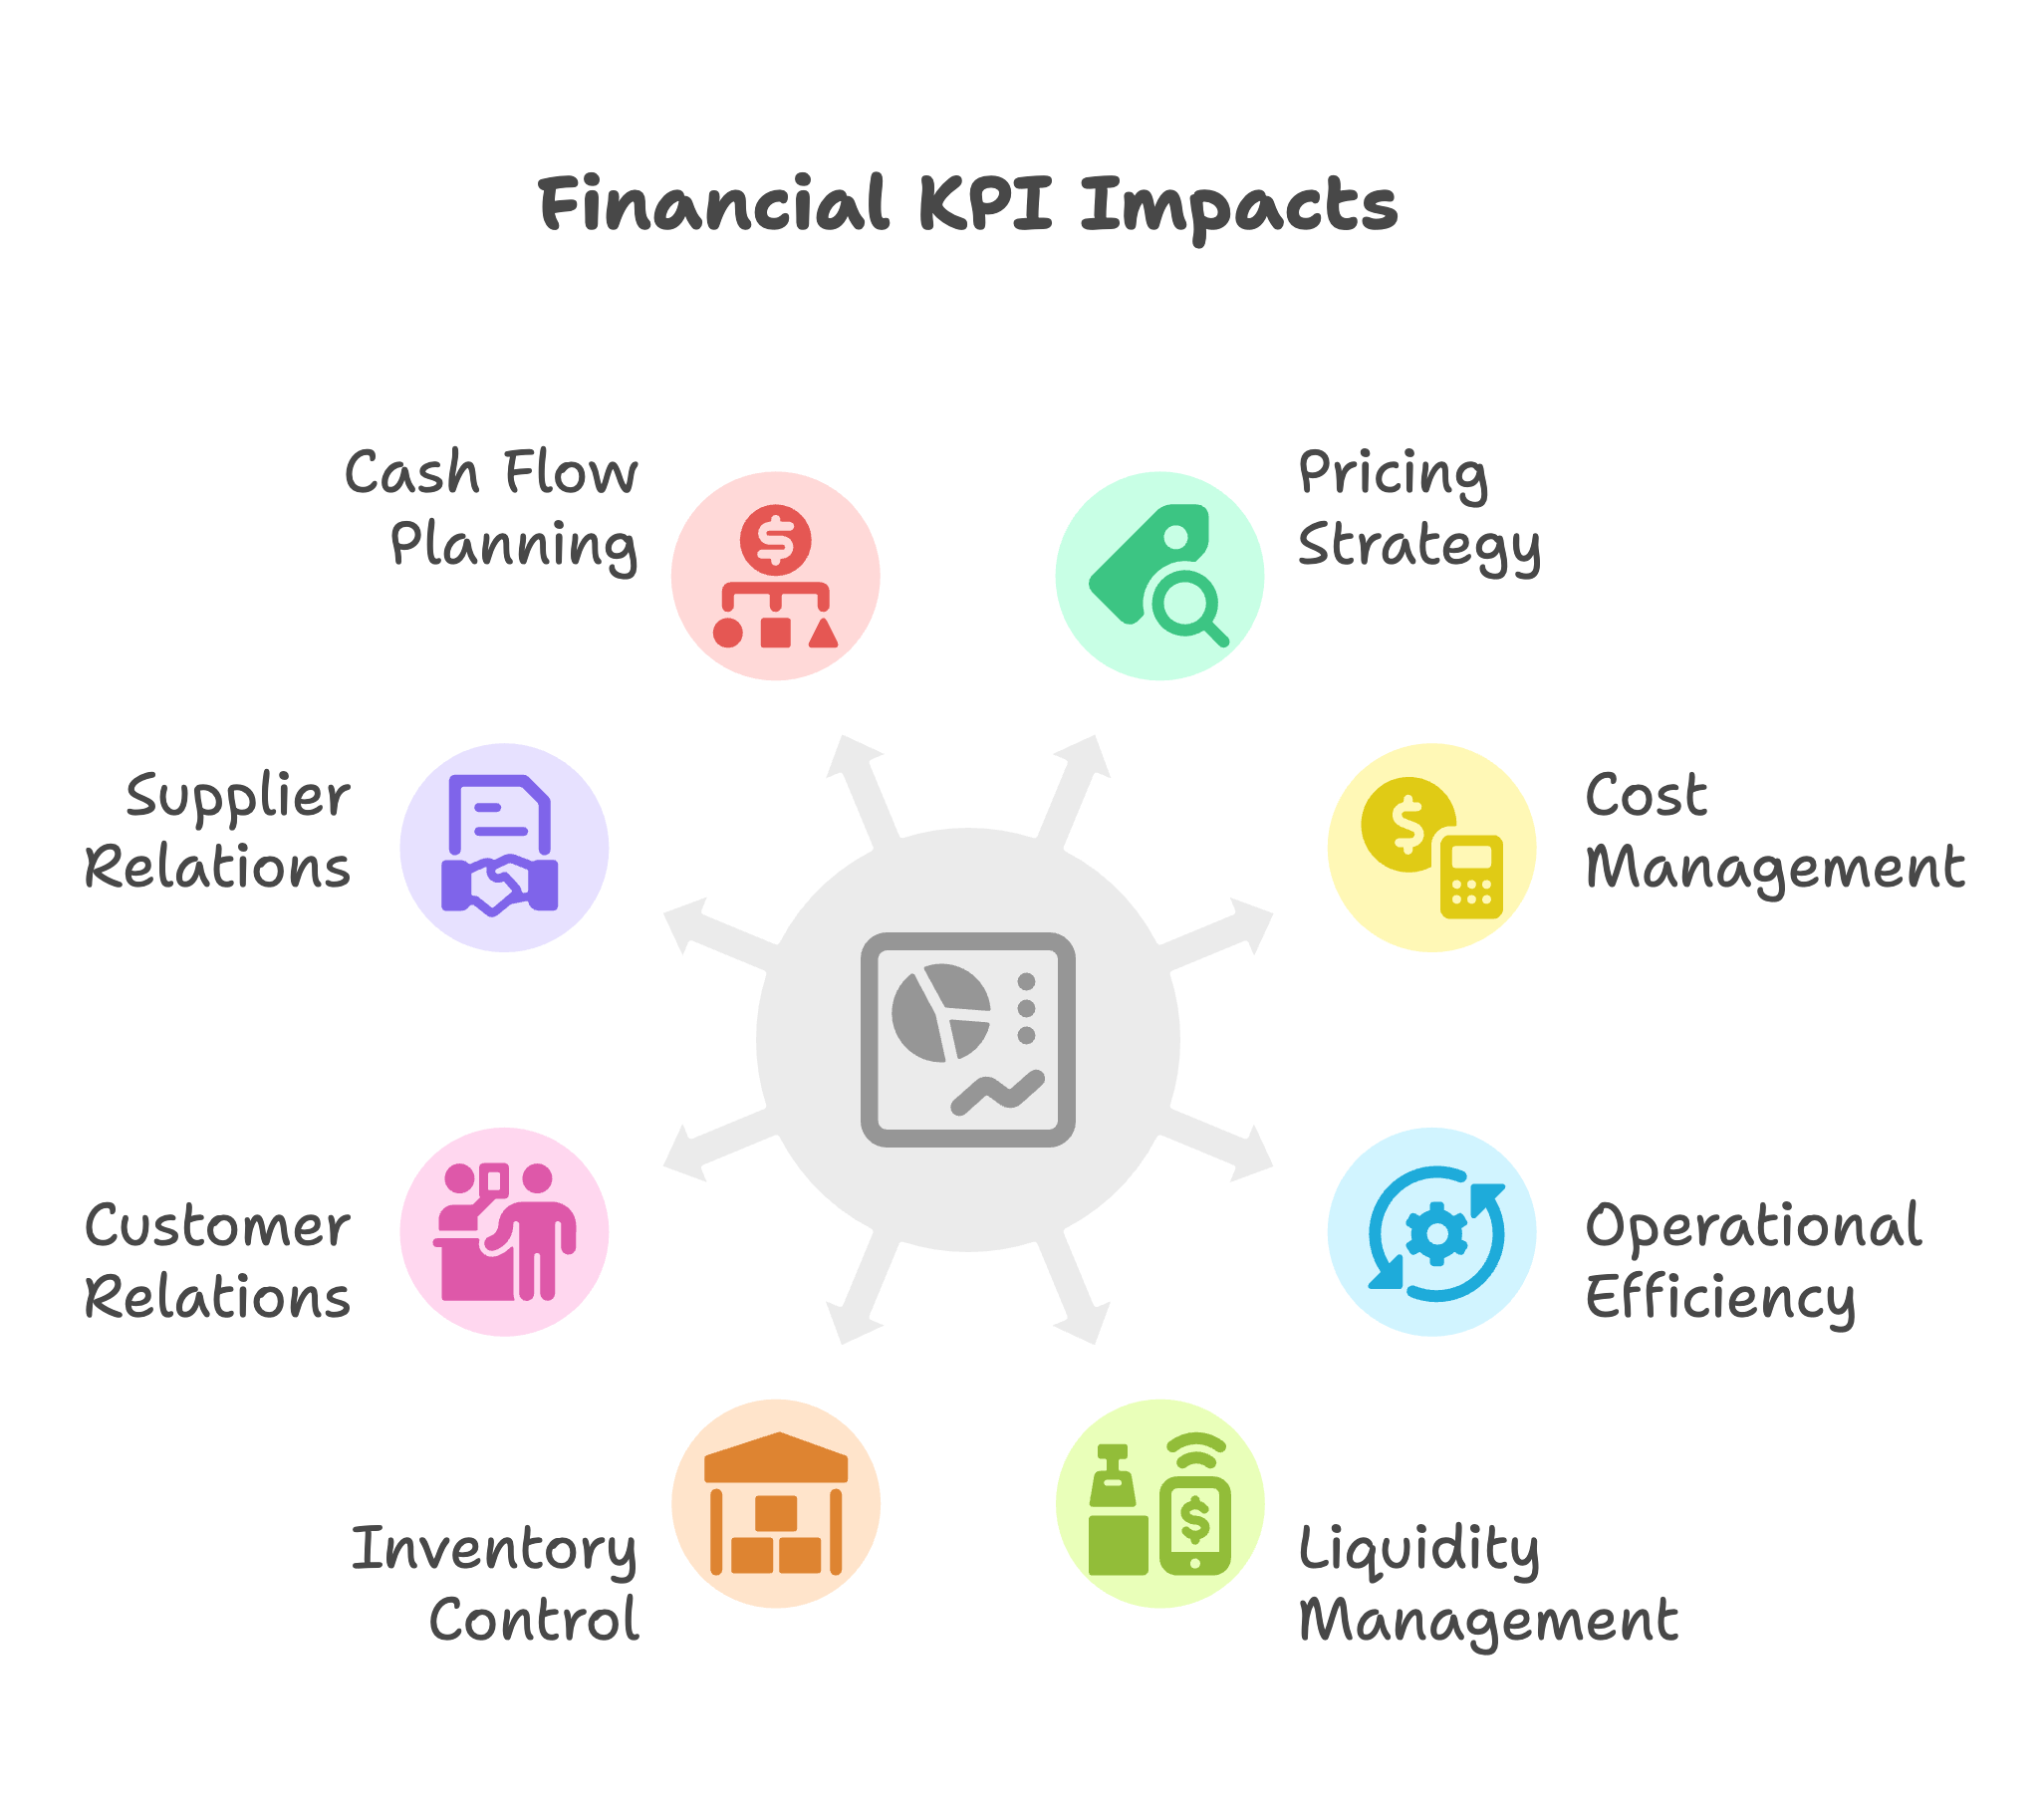
KPIs are not just numbers on a report—they are essential decision-making tools for effective financial management. When monitored regularly, these financial metrics help small business operators:
For small business operations, the right KPIs can reveal trends early, allowing for timely course correction and strategic adjustments. Whether a business is preparing for funding, trying to reduce costs, or scaling its operations, these financial metrics provide the data needed to move forward with confidence and achieve sustainable business goals.
Understanding your business strategy and aligning KPIs with strategic objectives ensures that you're measuring what matters most for long-term success. Each KPI should connect directly to specific business goals and provide actionable insights for improving financial performance.
Definition: Gross profit margin is a fundamental KPI that shows the percentage of revenue left after deducting direct costs of goods sold (COGS). This metric highlights how efficiently a company turns raw costs into profit and is essential for evaluating pricing strategies.
Formula:
Gross Profit Margin = (Revenue - COGS) ÷ Revenue × 100
Example: If a small business makes $200,000 in revenue and has $120,000 in COGS, the gross profit margin is 40 percent.
Why This KPI Matters: Gross profit margin helps business owners assess:
Low gross profit margins may suggest poor pricing, high production costs, or supply chain issues that require immediate attention to maintain financial performance.
Definition: Net profit margin represents the percentage of revenue left after all expenses are deducted, including taxes, rent, salaries, interest, and overhead. This KPI shows the bottom-line profitability of small business operations.
Formula:
Net Profit Margin = Net Profit ÷ Revenue × 100
Why This Financial Metric Matters: Net profit margin reflects the overall profitability of the business and is what the company truly earns after all operating costs are accounted for. This KPI is crucial for:
A shrinking net profit margin may indicate rising expenses, operational inefficiency, or pricing issues that threaten long-term business sustainability.
Definition: Operating cash flow is a critical KPI that measures the cash generated from the business's core activities. It excludes investing and financing cash flow and focuses solely on operational performance.
Formula:
Operating Cash Flow = Net Income + Non-Cash Expenses - Change in Working Capital
Why This Cash Flow Metric Matters: Cash flow determines if a small business can pay bills, employees, and reinvest in operations. Many profitable businesses still fail due to poor cash flow management. Monitoring this KPI ensures liquidity and solvency by:
Positive operating cash flow indicates that the business generates enough cash from its core activities to sustain and grow operations.
Definition: The current ratio is a liquidity KPI that compares a company's current assets to its current liabilities. It shows the business's ability to meet short-term obligations and maintain operational flexibility.
Formula:
Current Ratio = Current Assets ÷ Current Liabilities
Why This Metric Matters: A ratio below 1 may signal liquidity trouble and potential cash flow problems. A healthy current ratio typically falls between 1.2 and 2.0. This KPI helps evaluate:
Too high a ratio could also indicate excess idle assets that are not being invested productively to support business goals.
Definition: Similar to the current ratio but excludes inventory from assets, the quick ratio offers a stricter view of short-term financial health and immediate liquidity.
Formula:
Quick Ratio = (Current Assets - Inventory) ÷ Current Liabilities
Why This KPI Matters: Inventory can take time to convert to cash, especially during economic downturns or market shifts. The quick ratio shows whether a small business could survive an immediate financial hit without selling inventory. This financial metric is particularly important for:
Definition: This KPI shows how effectively a small business collects payments from its customers and manages credit policies.
Formula:
Accounts Receivable Turnover = Net Credit Sales ÷ Average Accounts Receivable
Why This Financial Metric Matters: A high turnover rate means customers are paying promptly, which improves cash flow and reduces bad debt risk. A low ratio suggests issues with collections processes or credit policies. This KPI affects:
Monitoring this metric helps optimize payment terms and collection procedures to support business objectives.
Definition: This metric indicates how often a small business pays its suppliers during a given period and reflects payment policy effectiveness.
Formula:
Accounts Payable Turnover = Total Supplier Purchases ÷ Average Accounts Payable
Why This KPI Matters: This financial metric shows how a business manages its payment cycle and supplier relationships. Too high a turnover might indicate missed early payment discounts, while too low may signal cash flow constraints or poor supplier relationships. Effective management involves:
Definition: DSO is a cash flow KPI that tells how many days it takes to collect payment after a sale is made, directly impacting working capital.
Formula:
DSO = (Accounts Receivable ÷ Total Credit Sales) × Number of Days
Why This Metric Matters: DSO directly affects cash flow patterns and working capital requirements. A higher DSO means capital is tied up in receivables for too long, which can strain operations. This KPI helps:
Small businesses must balance offering customer credit with prompt collections to maintain healthy financial performance.
Definition: This ratio measures how many times inventory is sold and replaced over a period, indicating inventory management efficiency.
Formula:
Inventory Turnover = COGS ÷ Average Inventory
Why This KPI Matters: This financial metric reveals how well a small business manages stock levels and meets customer demand. A low turnover may suggest overstocking or poor sales performance, while a high turnover indicates efficient inventory management but could risk stockouts. Effective inventory management:
Definition: This KPI tracks how fast a small business's sales are increasing over time and reflects market performance and business strategy effectiveness.
Formula:
Revenue Growth = [(Current Period Revenue - Previous Period Revenue) ÷ Previous Period Revenue] × 100
Why This Financial Metric Matters: Consistent revenue growth suggests a healthy sales pipeline, strong market demand, and effective marketing strategies. Stagnation or decline signals the need for strategic review. This KPI helps evaluate:
Regular monitoring supports strategic planning and resource allocation decisions.
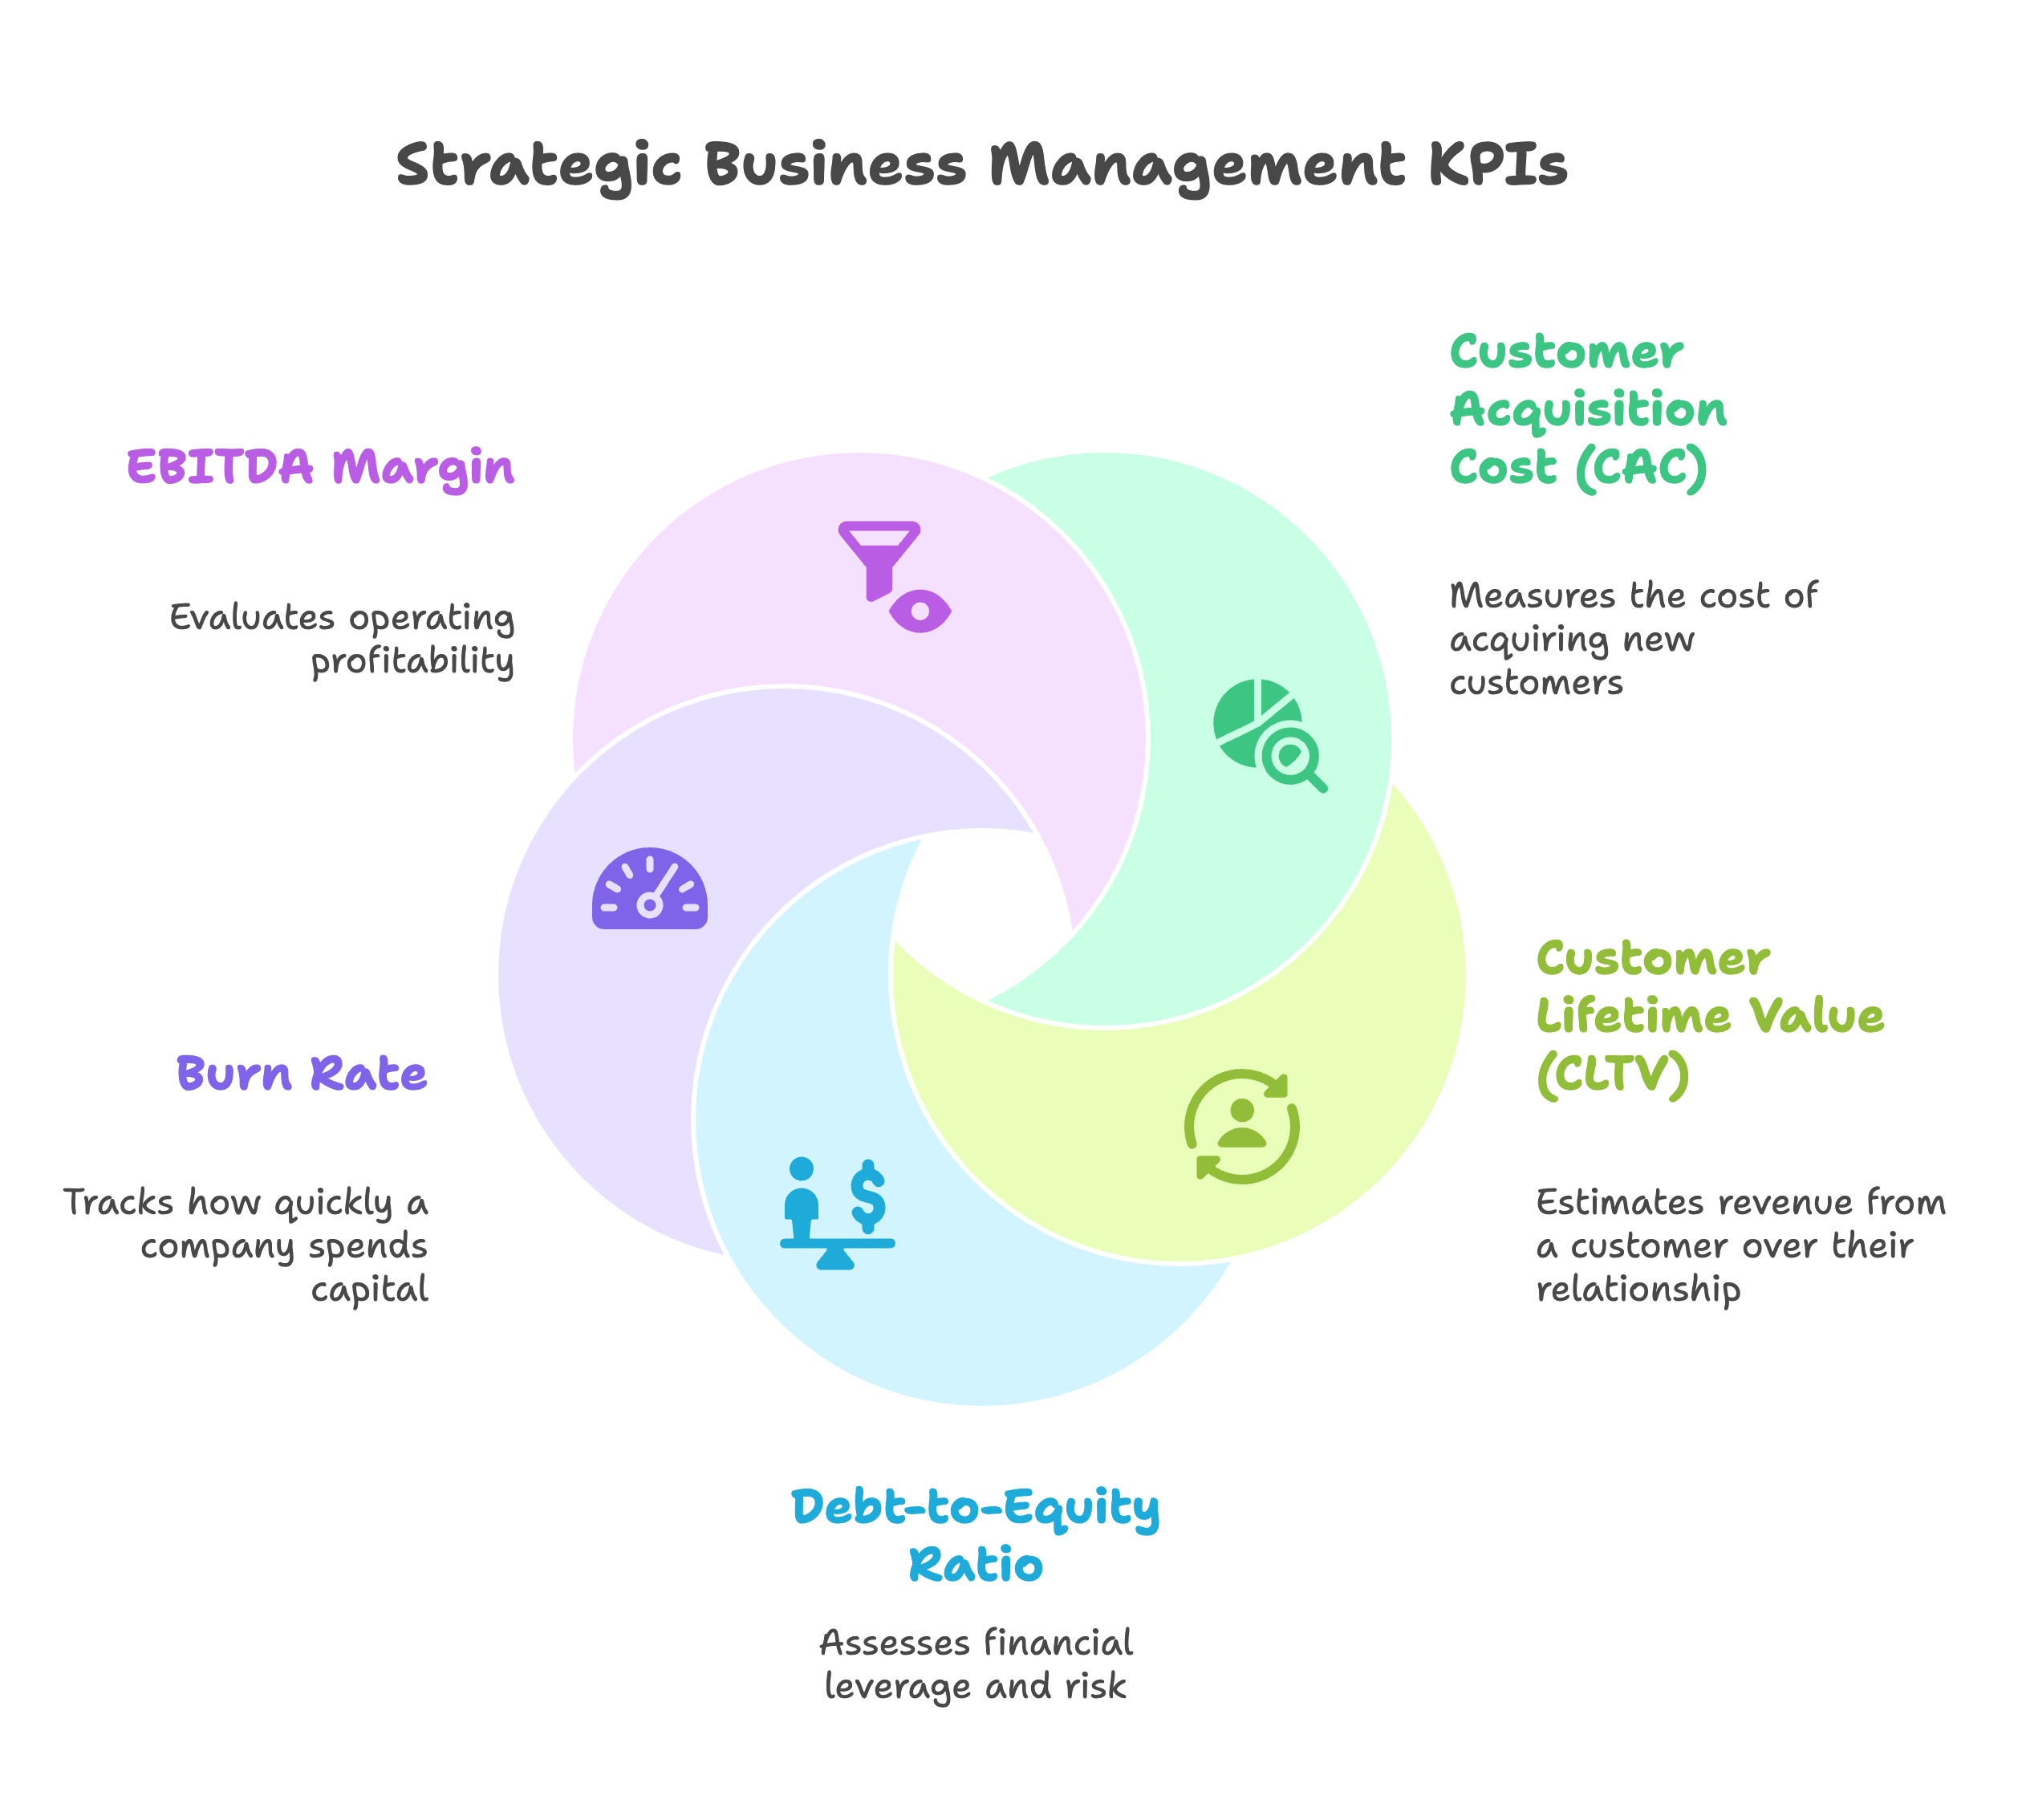
Definition: CAC is the total cost of acquiring a new customer, including marketing and sales expenses. This KPI is essential for evaluating marketing efficiency and scalability.
Formula:
CAC = Total Sales and Marketing Expenses ÷ Number of New Customers Acquired
Why This Key Performance Indicator Matters: If CAC is too high relative to customer value, the small business may struggle to scale profitably. CAC should always be evaluated alongside customer lifetime value (LTV) to ensure sustainable growth and profitable customer acquisition strategies.
Definition: CLTV estimates how much revenue a business earns from a typical customer over their entire relationship with the company.
Formula:
LTV = Average Purchase Value × Purchase Frequency × Customer Lifespan
Why This Financial Metric Matters: Knowing LTV helps evaluate how much to invest in customer acquisition and retention programs. A higher LTV than CAC is essential for profitability and sustainable business growth. This KPI supports:
Definition: This metric measures financial leverage and risk by comparing total liabilities to shareholders' equity, indicating capital structure health.
Formula:
Debt-to-Equity Ratio = Total Liabilities ÷ Shareholders' Equity
Why This KPI Matters: A high ratio suggests greater reliance on borrowed funds, which increases financial risk. While some debt is normal for small business operations, excessive leverage can threaten financial stability and limit growth opportunities.
Definition: Burn rate measures how quickly a company spends its available capital. This KPI is critical for startups and growing small businesses with limited cash runway.
Formula:
Burn Rate = Monthly Operating Expenses
Why This Cash Flow Metric Matters: Tracking burn rate helps businesses understand how long they can operate before needing new funding. It supports critical decision-making about:
Definition: Earnings before interest, taxes, depreciation, and amortization (EBITDA) margin gives a clean look at operating profitability by removing non-operational costs.
Formula:
EBITDA Margin = EBITDA ÷ Revenue × 100
Why This Financial Metric Matters: This KPI is widely used by investors and lenders to assess core business profitability and compare performance across different companies and industries. It provides insight into operational efficiency and earning potential.
Successful KPI tracking requires systematic implementation and regular monitoring. Small business operators should:
Establish Baseline Measurements:
Choose Appropriate Tracking Tools:
Create Action Plans for KPI Improvement:
Effective KPI tracking goes beyond simple measurement—it requires integration with overall business strategy and decision-making processes. Consider these approaches:
Align KPIs with Business Goals:
Establish KPI-Based Decision Making:
Modern accounting and business intelligence tools can automate much of the KPI calculation and reporting process:
Cloud-Based Accounting Platforms:
Business Intelligence Dashboards:
Integration Capabilities:
Small business owners often make these common mistakes when implementing KPI tracking:
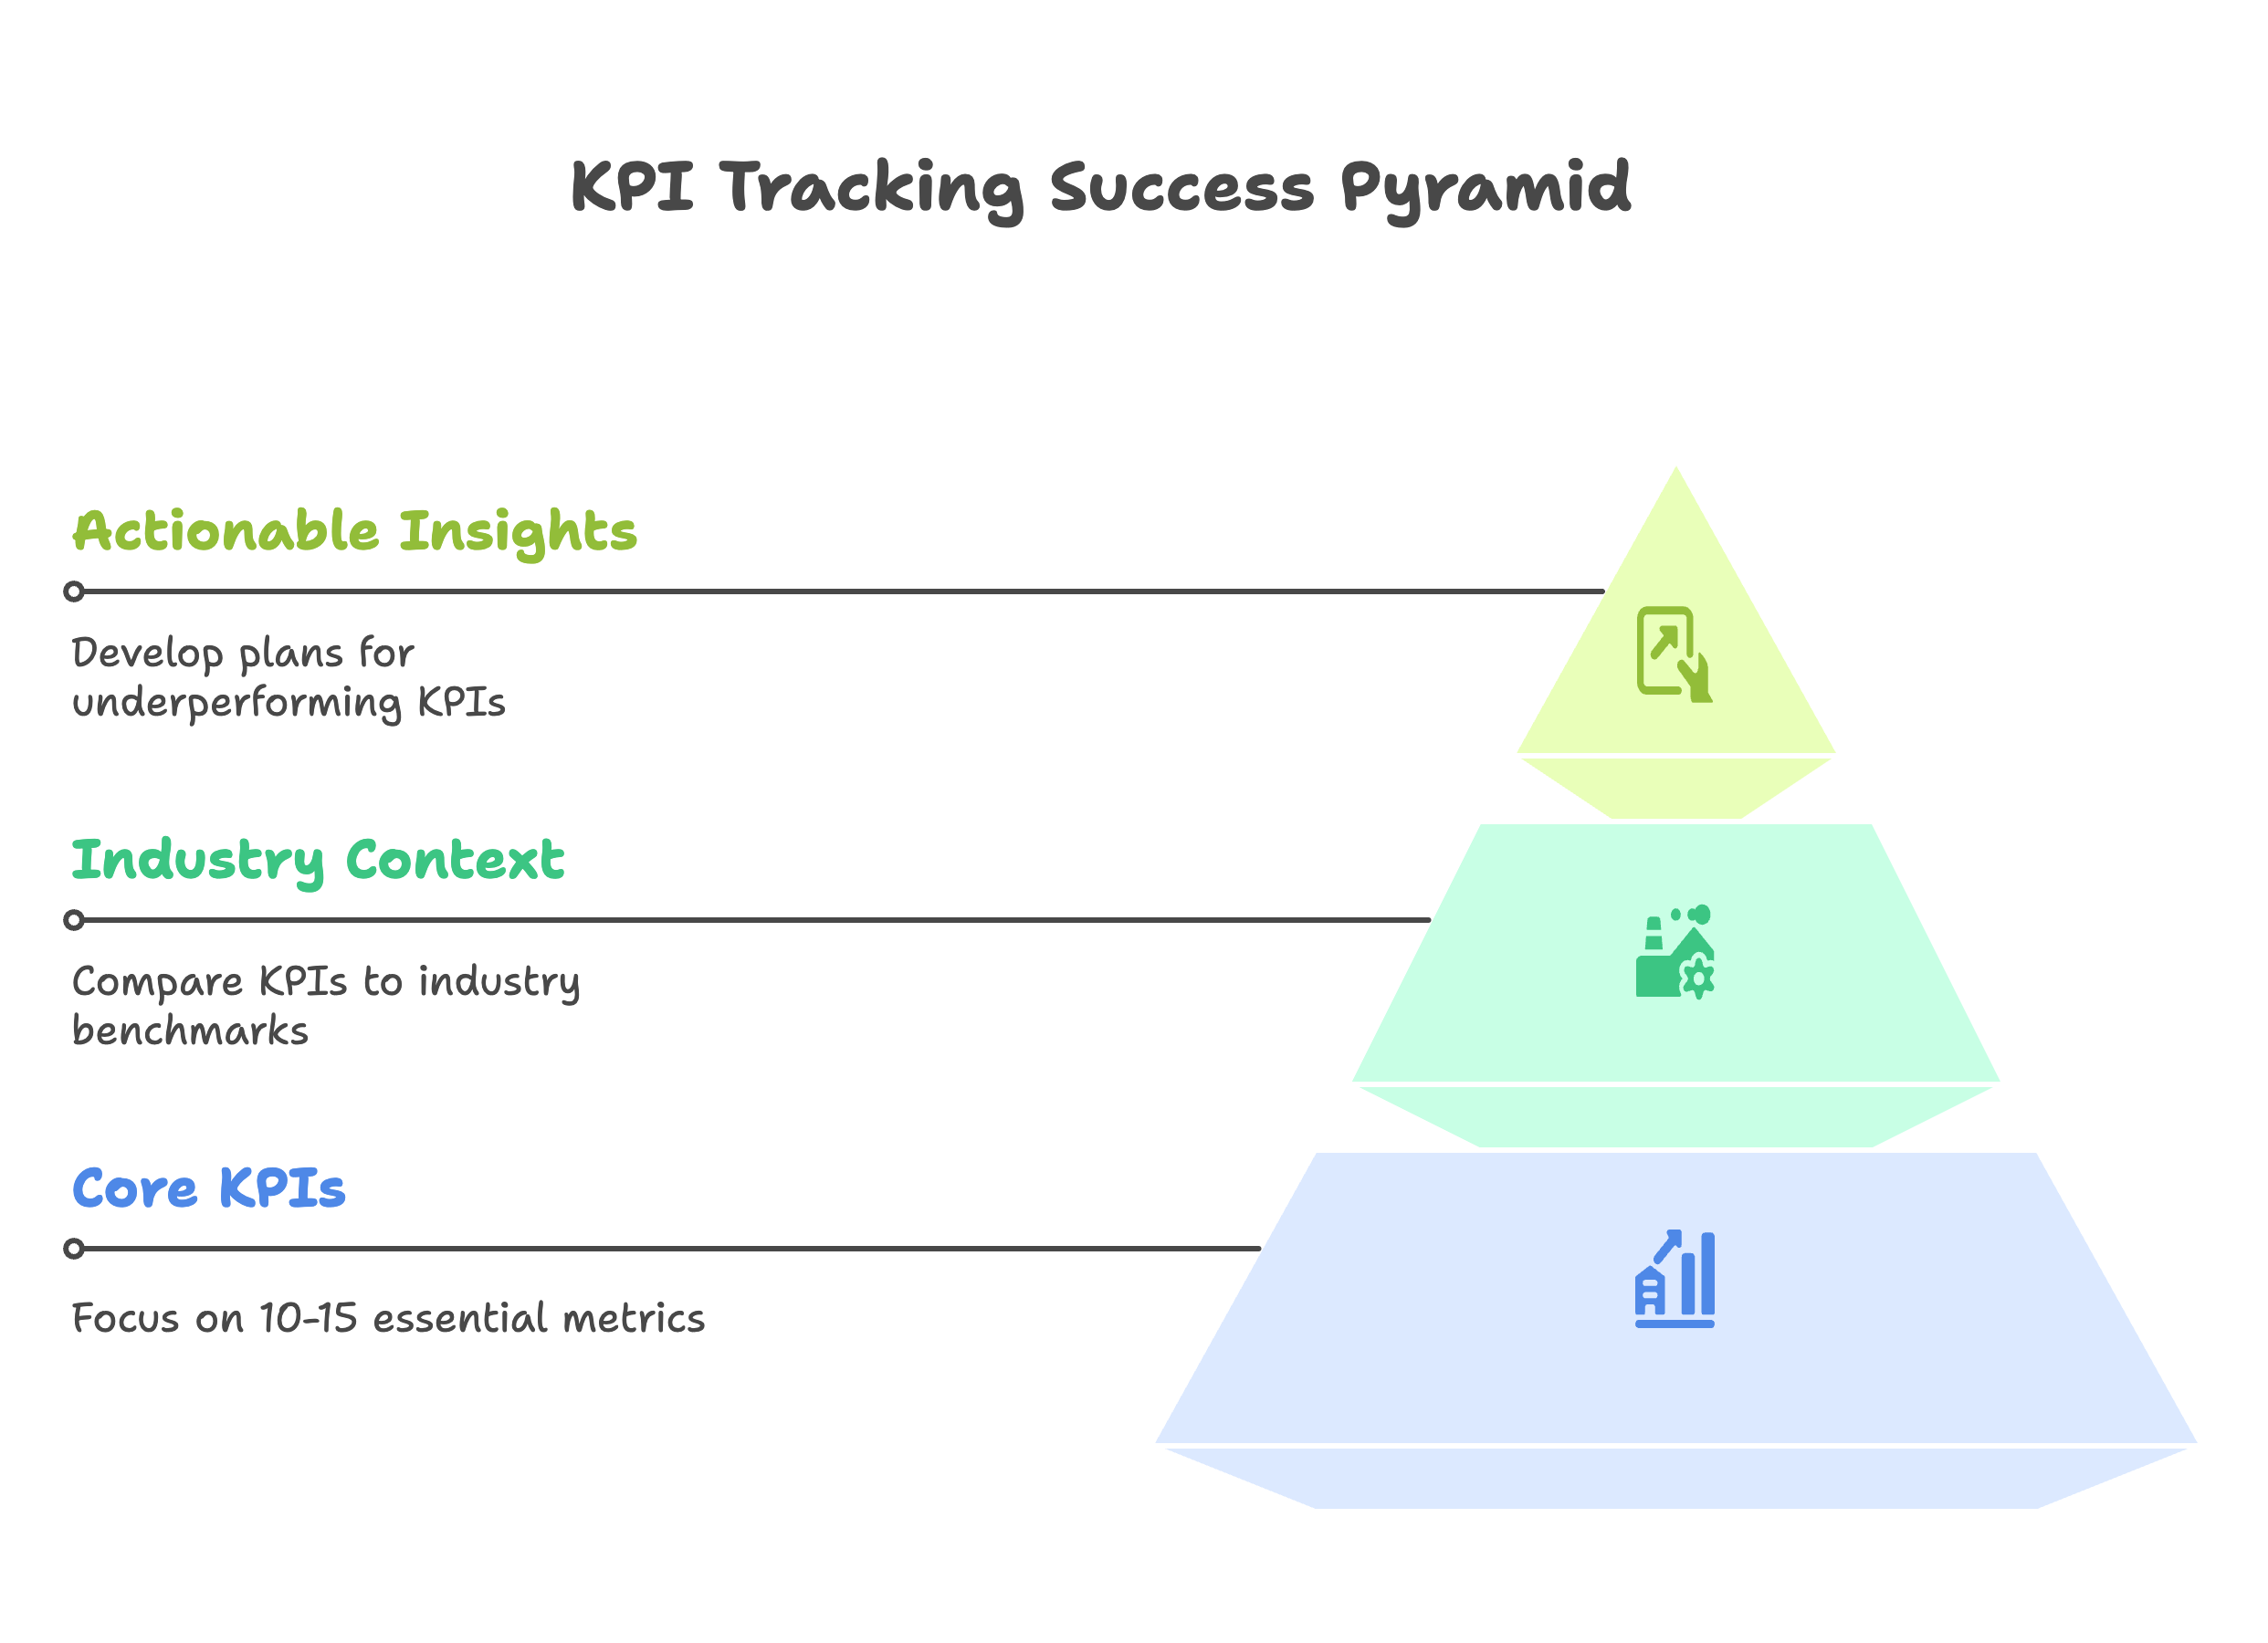
Tracking Too Many Metrics:
Ignoring Industry Context:
Failing to Act on KPI Insights:
CPA firms play a vital role in helping small businesses understand and improve their financial KPIs. However, many small firms lack the bandwidth for regular KPI analysis and strategic consulting. That is where outsourced support becomes invaluable for extending service capabilities.
Professional accountants can provide:
KPI Setup and Implementation:
Regular Analysis and Consulting:
Strategic Advisory Services:
Madras Accountancy provides offshore services that help CPA firms:
With better visibility into these financial metrics, CPA firms become strategic partners instead of just compliance vendors, helping clients achieve their business objectives through informed decision-making.
CPA firms that master KPI tracking and analysis can differentiate themselves in the market by:
Developing Industry Expertise:
Offering Proactive Advisory Services:
The future of KPI tracking for small businesses will be shaped by several technology trends:
Artificial Intelligence and Machine Learning:
Real-Time Data Integration:
Enhanced Visualization and Reporting:
Financial KPIs are not optional for small business success—they are the foundation of good decision-making, effective risk management, and sustainable long-term growth. From cash flow patterns to profit margins, from customer acquisition costs to working capital ratios, each metric tells an important part of the business story.
When tracked together systematically, these financial metrics provide a comprehensive view of business health and performance. They enable business owners to make informed decisions about pricing, hiring, expansion, and resource allocation while working toward specific business goals and objectives.
The key to successful KPI implementation lies in choosing the right metrics that align with your business strategy, implementing reliable tracking systems, and taking action based on the insights these measurements provide. Whether you're monitoring basic financial performance or advanced operational efficiency metrics, consistency and accuracy in measurement are essential.
For CPA firms supporting small business clients, helping track and interpret these KPIs represents a way to add serious strategic value beyond traditional compliance services. With proper KPI tracking and analysis, small businesses can identify opportunities for improvement, anticipate challenges before they become critical, and make data-driven decisions that support sustainable growth.
Through effective financial management and regular monitoring of key performance indicators, small businesses can build the foundation for long-term success while achieving their most important business objectives. The investment in proper KPI tracking pays dividends through improved decision-making, better financial performance, and increased confidence in business strategy execution.
And with offshore support from Madras Accountancy, CPA firms can deliver these high-value KPI services efficiently, accurately, and without overwhelming their internal teams, enabling them to serve more clients while providing deeper strategic insights that drive real business results.
Question: What are the most important financial KPIs every small business should track regularly?
Answer: Essential financial KPIs for small businesses include gross profit margin, net profit margin, current ratio, quick ratio, and cash flow from operations. Revenue growth rate, customer acquisition cost, customer lifetime value, and accounts receivable turnover provide insights into business performance and efficiency. Debt-to-equity ratio, inventory turnover, and working capital measure financial health and operational efficiency. These KPIs help business owners understand profitability, liquidity, efficiency, and growth trends, enabling informed decision-making and early identification of potential problems requiring attention.
Question: How should small businesses calculate and interpret gross profit margin and net profit margin?
Answer: Gross profit margin equals gross profit divided by revenue, showing the percentage of revenue remaining after direct costs of goods sold. Net profit margin equals net income divided by revenue, indicating overall profitability after all expenses. Healthy gross margins vary by industry but typically range from 20-50% for most businesses, while net margins of 5-15% are generally considered good for small businesses. Declining margins may indicate pricing pressure, rising costs, or operational inefficiencies. Monitor trends over time and compare to industry benchmarks to assess performance and identify improvement opportunities.
Question: What liquidity ratios should small businesses monitor to ensure adequate cash flow?
Answer: Small businesses should monitor current ratio (current assets ÷ current liabilities) and quick ratio (liquid assets ÷ current liabilities) to assess short-term financial health. Current ratios of 1.5-3.0 generally indicate healthy liquidity, while quick ratios above 1.0 suggest adequate liquid assets to cover immediate obligations. Cash ratio (cash ÷ current liabilities) provides the most conservative liquidity measure. Monitor cash conversion cycle, which measures time to convert inventory and receivables into cash. Poor liquidity ratios may indicate collection problems, excess inventory, or insufficient working capital management.
Question: How do customer-related KPIs impact small business financial performance?
Answer: Customer-related KPIs significantly impact financial performance through revenue growth and profitability insights. Customer acquisition cost (CAC) measures marketing and sales expenses per new customer, while customer lifetime value (CLV) estimates total revenue from customer relationships. Healthy businesses maintain CLV-to-CAC ratios of 3:1 or higher. Customer retention rate, average order value, and repeat purchase rate indicate customer satisfaction and revenue sustainability. Monthly recurring revenue for subscription businesses and customer concentration ratios help assess revenue stability and risk. These metrics guide marketing investments and customer relationship strategies.
Question: What operational efficiency KPIs help small businesses optimize performance?
Answer: Key operational efficiency KPIs include inventory turnover (cost of goods sold ÷ average inventory), accounts receivable turnover (revenue ÷ average receivables), and accounts payable turnover (COGS ÷ average payables). Employee productivity metrics like revenue per employee and gross profit per employee measure workforce efficiency. Asset turnover ratios indicate how effectively businesses use assets to generate revenue. Days sales outstanding (DSO) measures collection efficiency, while days inventory outstanding (DIO) shows inventory management effectiveness. These KPIs identify operational bottlenecks and improvement opportunities for better resource utilization.
Question: How should small businesses use financial KPIs for decision-making and planning?
Answer: Use financial KPIs for decision-making by establishing baseline measurements, setting realistic targets, monitoring trends over time, and comparing performance to industry benchmarks. Regular KPI review meetings help identify problems early, evaluate strategy effectiveness, and guide resource allocation decisions. Implement dashboard reporting for real-time visibility, analyze KPI relationships and correlations, and investigate significant variances from targets. Use KPIs to support budget planning, pricing decisions, investment priorities, and operational improvements. Share relevant KPIs with key team members to align organizational focus on critical performance drivers.
Question: What tools and software can small businesses use to track and analyze financial KPIs?
Answer: Small businesses can track financial KPIs using accounting software like QuickBooks, Xero, or FreshBooks with built-in reporting features, spreadsheet templates for custom calculations, and business intelligence tools like Tableau or Power BI for advanced analytics. Cloud-based dashboard solutions including Klipfolio, Geckoboard, or DataBox provide real-time KPI monitoring. Many accounting software packages offer automated KPI calculations and comparative reporting. Choose tools based on complexity needs, integration requirements, and budget constraints. Ensure chosen solutions provide accurate data, easy updates, and actionable insights for effective performance management.
Question: How frequently should small businesses review and update their financial KPIs?
Answer: Small businesses should review critical financial KPIs monthly for timely decision-making, with some metrics requiring weekly or daily monitoring during periods of change or stress. Conduct comprehensive quarterly reviews to assess trends, compare to targets, and adjust strategies as needed. Annual reviews should evaluate KPI relevance, update benchmarks, and refine measurement methods. High-growth businesses may need more frequent monitoring, while stable businesses can review less frequently. Establish regular reporting schedules, automate data collection where possible, and ensure KPI reviews result in actionable insights and decisions rather than just data collection.

Single-entry vs double-entry bookkeeping made simple: how each accounting system works, the key differences, and which one your small business needs.
%2075-100%20(12).png)
CPA vs EA (enrolled agent) vs tax attorney: how each tax professional differs, who can represent you to the IRS, and which fits your tax needs.
%2075-100%20(9).png)
Learn how tax professionals should respond to a data breach, report theft to the IRS and states, notify clients, meet FTC rules, and prevent future attacks.