



Financial modeling for business valuation turns a company's history and its expected future into a number that a buyer, lender, investor or the IRS will accept. The model sits under every serious valuation: a sale, a buy-in, an ESOP, a gift or estate filing, a 409A grant or a shareholder dispute. A weak model produces a value nobody can defend. A good one shows exactly which assumptions drive the answer, so the people across the table argue about growth and risk instead of spreadsheet errors.
The IRS's own business valuation guidelines in IRM 4.48.4 name three generally accepted approaches (asset-based, market and income) and say all three should be considered, with professional judgment deciding which ones carry weight. Most valuation models are built around that structure.
A valuation model has two jobs. First, it normalizes the past: it takes three to five years of financial statements, strips out one-time items and owner perks, and shows what the business really earns. Second, it projects that earning power forward and converts it into present value.
If the historical statements are not reliable, nothing downstream is either. A model is only as good as the income statement, balance sheet and cash flow statement it starts from, and those three must tie. Our explainer on how the three financial statements connect covers the linkages a valuation model depends on.
The standard of value matters too. Fair market value (the tax standard) assumes a hypothetical willing buyer and seller. Fair value under ASC 820 is a financial reporting measure. Investment value is what one specific buyer would pay, including its own synergies. Pick the standard first, because it changes which synergies, discounts and data you can use.
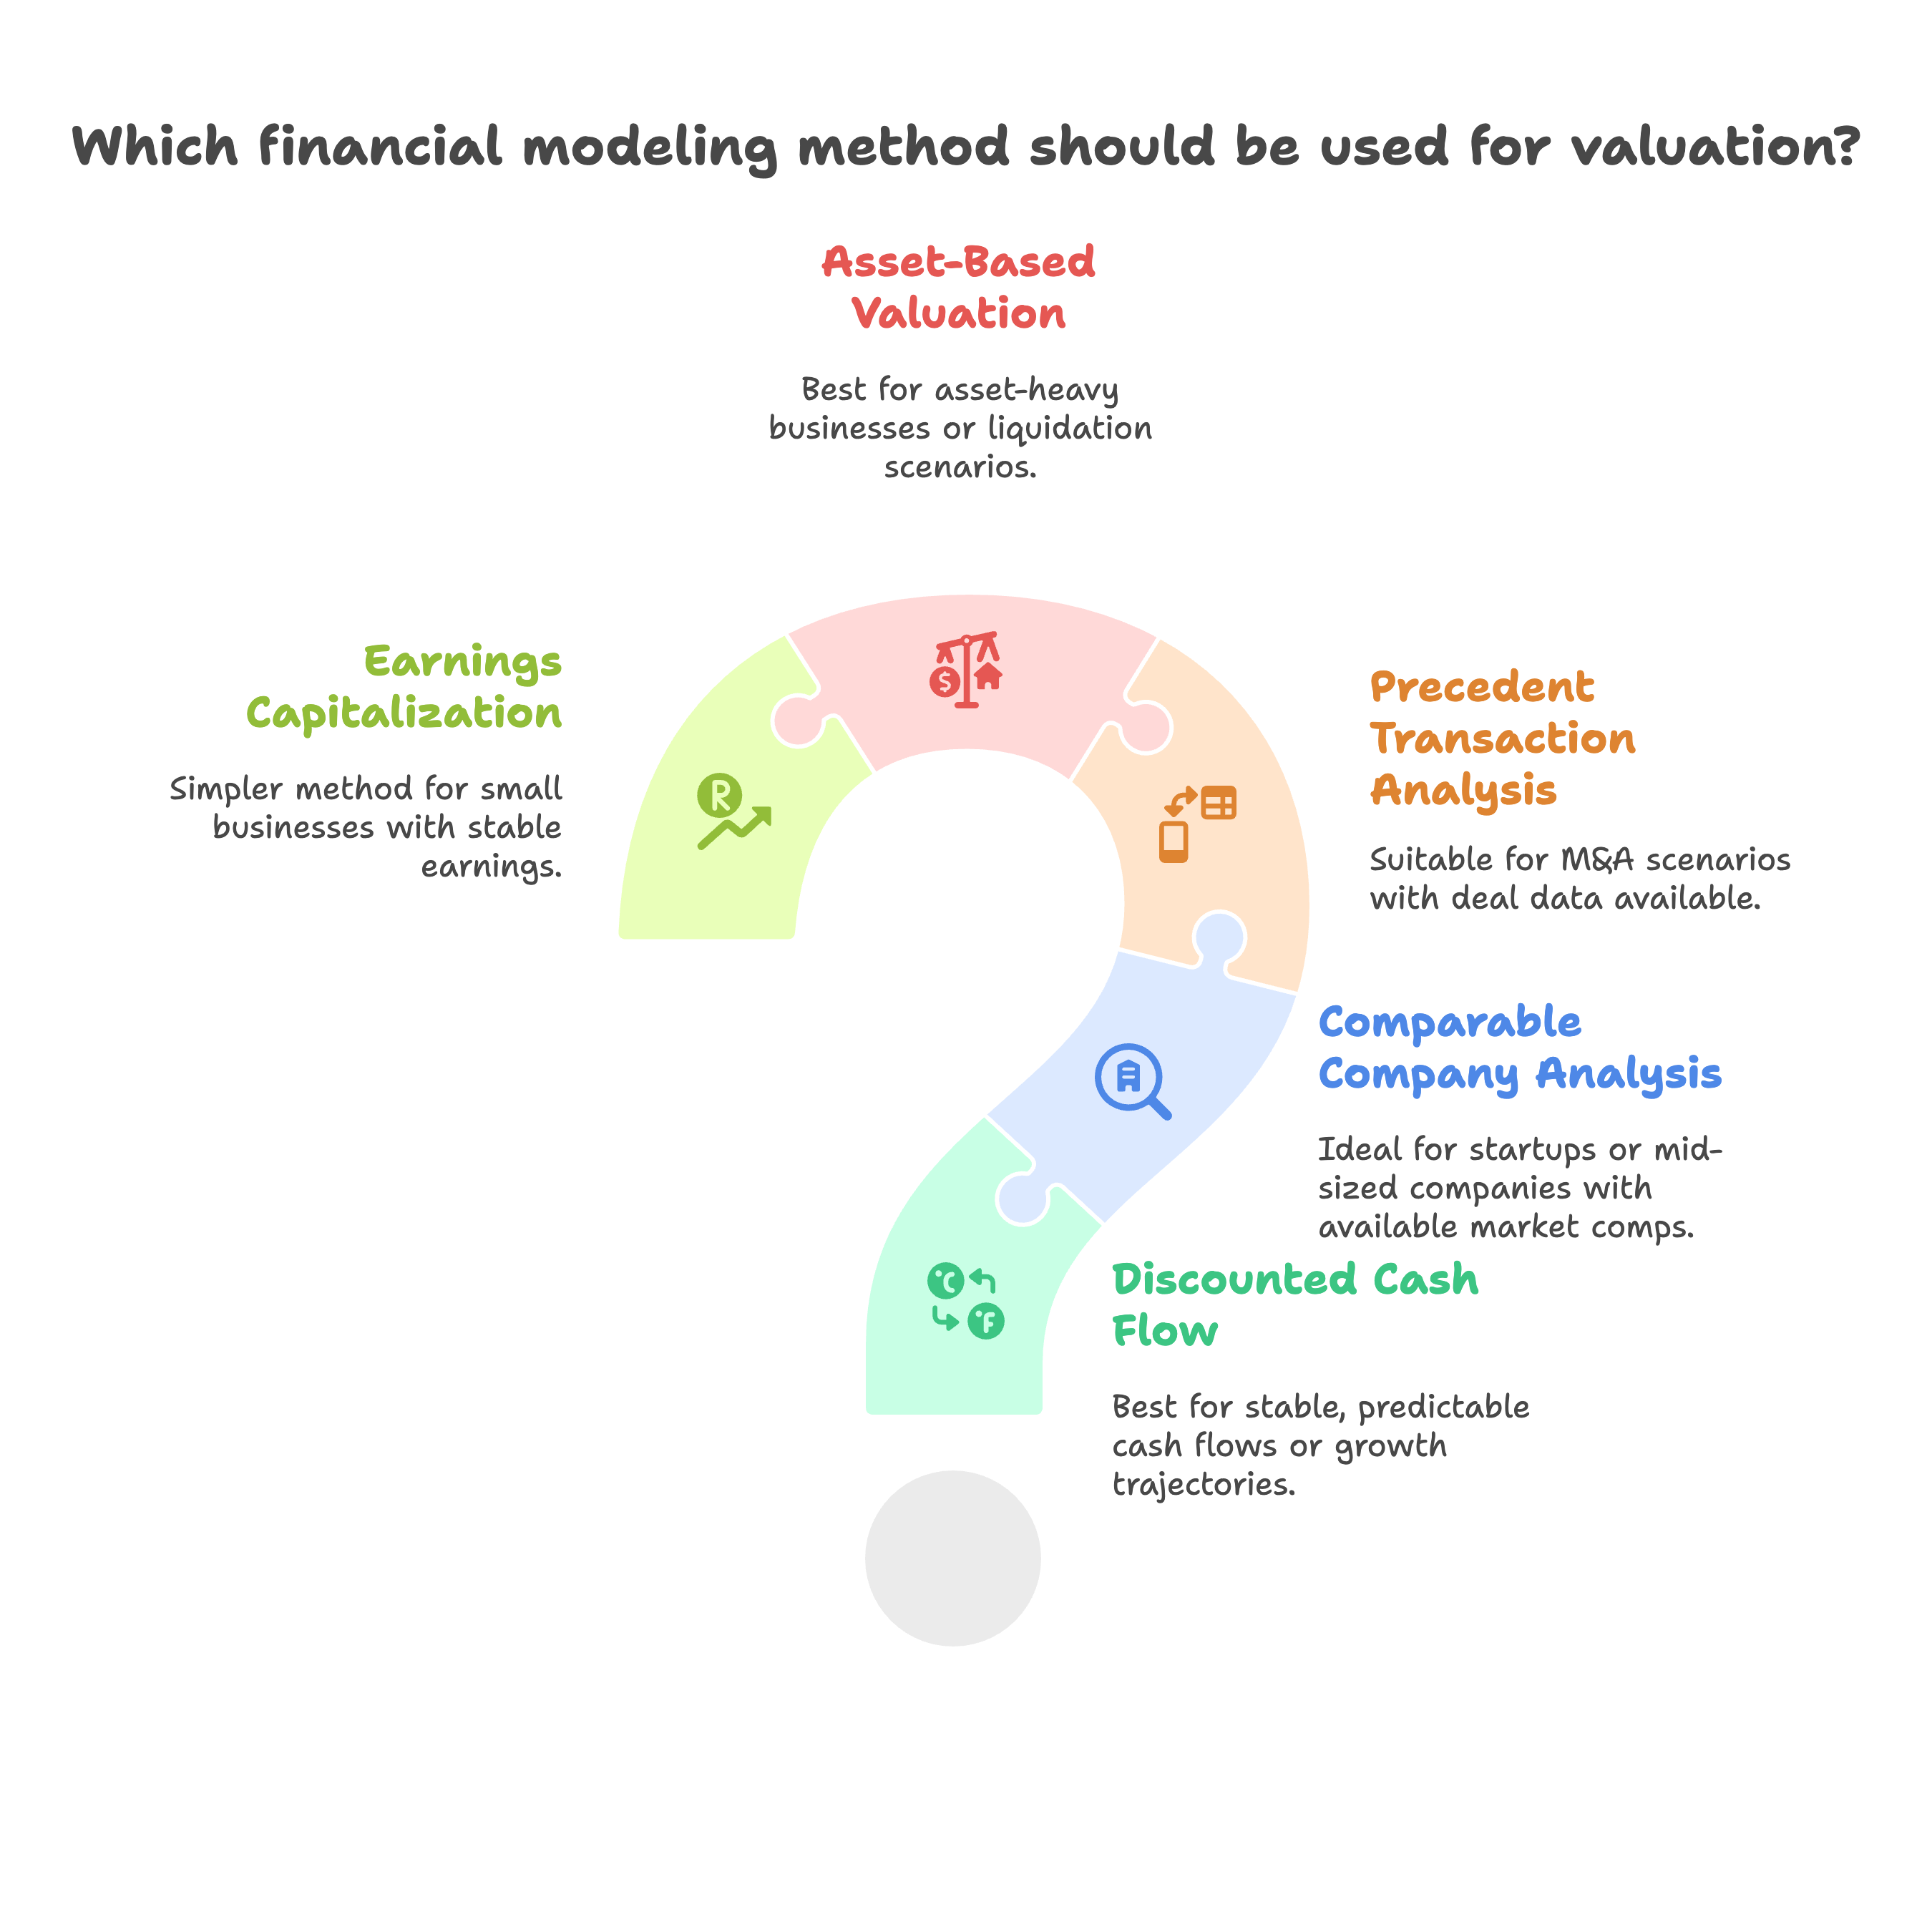
| Approach | Main methods | Best fit | Watch out for |
|---|---|---|---|
| Income | Discounted cash flow (DCF), capitalization of earnings | Businesses with forecastable cash flow | Terminal value dominating the answer |
| Market | Guideline public company multiples, precedent transactions | Industries with good deal and trading data | Comparables that are larger or differently structured |
| Asset-based | Adjusted net asset value, liquidation value | Holding companies, asset-heavy or distressed firms | Missing unrecorded intangibles and goodwill |
DCF projects unlevered free cash flow (cash available to all capital providers) for five to ten years, then adds a terminal value for everything after. Both are discounted at the weighted average cost of capital (WACC). It is the most flexible method and the one most exposed to optimism, because small changes in growth or discount rate move the result a lot.
This is a single-period DCF: take one year of normalized cash flow, divide by a capitalization rate (discount rate minus long-term growth). It suits small, stable companies where a detailed five-year forecast would add false precision.
Guideline company and precedent transaction methods apply multiples such as EV/EBITDA or EV/revenue from comparable businesses. They are quick and grounded in real prices, but public companies are usually far larger and more liquid than the private subject, so the multiples need adjusting. Industry-specific data helps here. For example, our breakdown of accounting firm valuation multiples in 2026 shows how practice deals are priced on revenue and EBITDA.
Adjusted net asset value restates each asset and liability to market value. It sets a floor for operating companies and is often the primary method for real estate holding entities. For property-heavy businesses, the modeling techniques in our real estate financial modeling guide apply to the underlying assets.
Start with at least three years of statements. Adjust for owner compensation above or below market, related-party rent, one-time legal settlements, PPP-era items, and personal expenses run through the business. Document every adjustment, because the buyer's diligence team will test each one. The questions they will ask are in our M&A due diligence checklist.
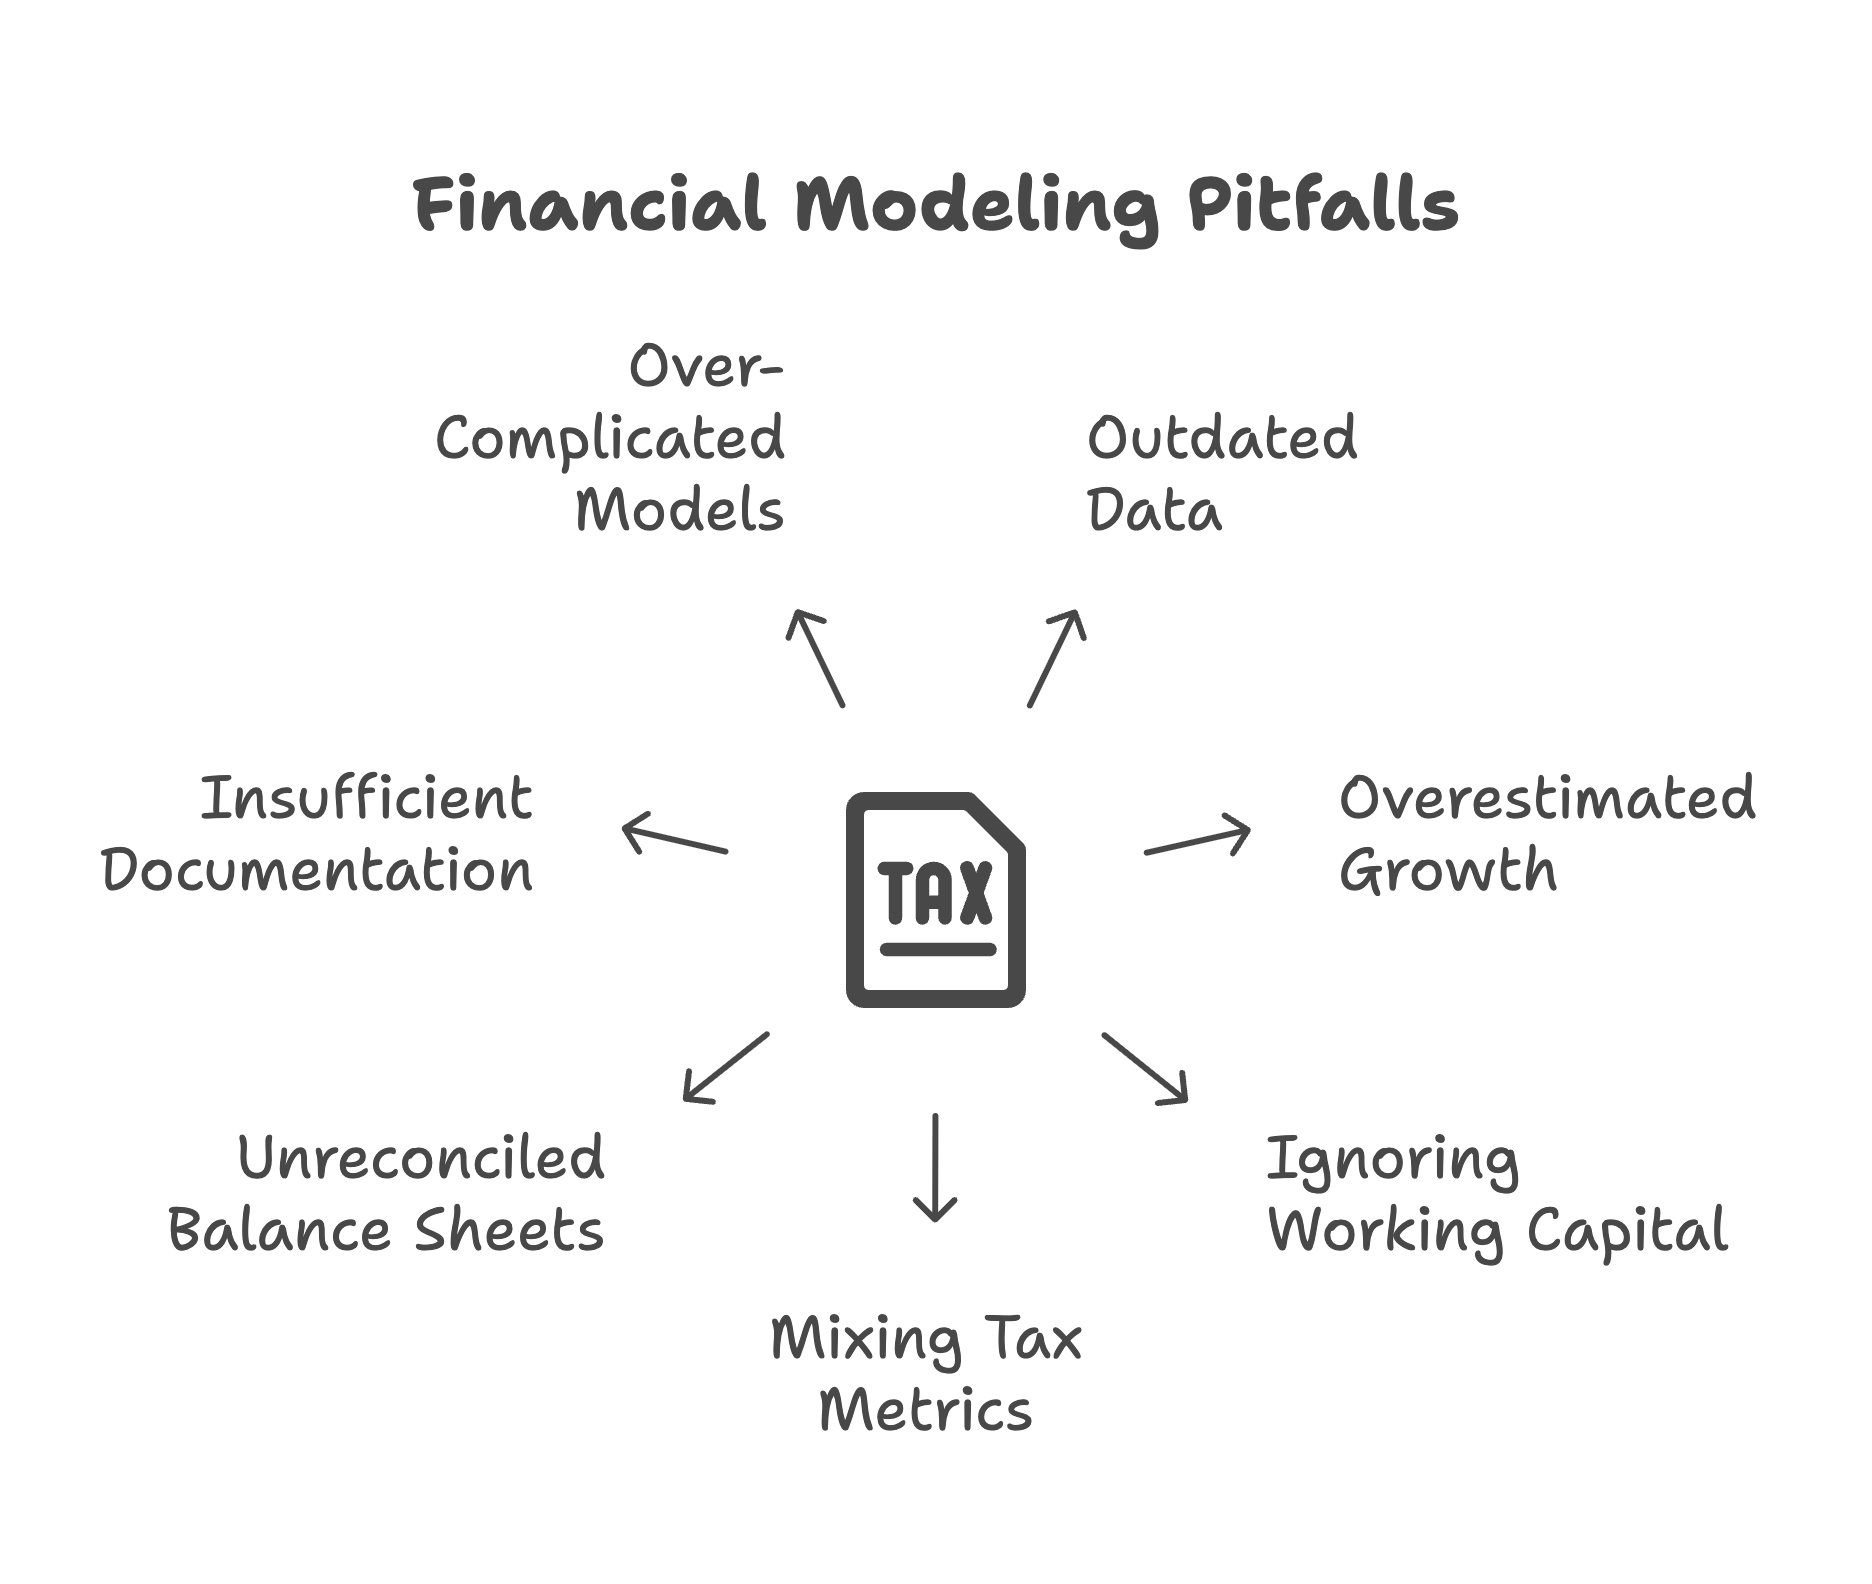
Forecast revenue from drivers (units, price, customers, utilization) instead of a single growth percentage. Tie gross margin and operating expenses to those drivers. Ratios from the historical period are the reasonableness check; our guide to financial ratio analysis for small businesses lists the ones that reveal an unrealistic forecast fastest.
Growth consumes cash. Receivables, inventory and payables should move with revenue using days-based assumptions, and capital spending should support the forecast volume. Ignoring working capital is one of the most common reasons a DCF overstates value. The mechanics are covered in our piece on working capital management for growing businesses.
Tax lines in a 2026 model need to reflect the One Big Beautiful Bill Act (July 2025):
The federal corporate rate stays at 21%, and state taxes come on top. Pass-through entities need a separate decision about whether to tax-affect earnings. For acquisitions structured as asset purchases, the buyer's Section 197 amortization of goodwill over 15 years creates a tax shield worth modeling separately.
WACC blends the cost of equity and after-tax cost of debt by target capital structure. Cost of equity usually starts with the risk-free rate (the 20-year Treasury yield is a common reference, available from the Treasury daily yield curve), adds an equity risk premium, then size and company-specific premiums. Small private companies routinely land in the high teens or above. State the source and date of every input.
Use either the Gordon growth formula (final-year cash flow × (1 + g) ÷ (WACC − g)) or an exit multiple. Run both and compare. If the growth method implies an EBITDA multiple far above what similar companies trade for, the growth rate is too high.
A single value is a guess. A grid showing value across discount rate and growth assumptions shows the reader where the risk sits. Scenario toggles for base, downside and upside cases follow the same logic as cash flow scenario planning, applied to value instead of liquidity.
Take a services business with $10.0 million of revenue and assume:
| Year | Revenue ($M) | EBITDA ($M) | Unlevered FCF ($M) | PV at 14% ($M) |
|---|---|---|---|---|
| 1 | 10.80 | 1.62 | 0.90 | 0.79 |
| 2 | 11.66 | 1.75 | 0.98 | 0.75 |
| 3 | 12.60 | 1.89 | 1.05 | 0.71 |
| 4 | 13.61 | 2.04 | 1.14 | 0.67 |
| 5 | 14.69 | 2.20 | 1.23 | 0.64 |
The five years of cash flow are worth $3.57 million today. Terminal value is $1.23M × 1.03 ÷ 0.11 = $11.50 million at the end of year 5, or $5.98 million in present value. Enterprise value comes to about $9.5 million, which is 6.4 times current EBITDA of $1.5 million.
Two things stand out. Terminal value is 63% of the answer, which is normal and is exactly why the terminal assumptions deserve the most scrutiny. And the terminal value implies about 5.2 times year-5 EBITDA, which you would compare against market multiples for the sector.
The sensitivity grid shows how much judgment is embedded:
| WACC \ Terminal growth | 2% | 3% | 4% |
|---|---|---|---|
| 13% | $9.84M | $10.53M | $11.36M |
| 14% | $8.99M | $9.54M | $10.20M |
| 15% | $8.27M | $8.72M | $9.25M |
A one-point move in each direction swings value by roughly $3 million. Enterprise value then converts to equity value by subtracting debt and adding excess cash.
Excel remains the default. It is flexible, every reviewer can open it, and auditors and opposing experts expect it. Its weakness is error risk in large linked workbooks.
Google Sheets works for collaborative drafts with clients but is less suited to heavy models.
FP&A platforms such as Jirav, Mosaic and Fathom pull data from QuickBooks or Xero and handle driver-based forecasting well. They are better for ongoing planning than for a one-off valuation report. Companies already running a rolling forecast can often reuse its drivers as the valuation forecast.
Market data services (Capital IQ, PitchBook, and private-company transaction databases) supply comparables and deal multiples. Subscription costs vary widely, so confirm current pricing with each vendor.
AICPA members performing valuations must follow Statement on Standards for Valuation Services VS Section 100. It distinguishes a valuation engagement (full analysis, a conclusion of value) from a calculation engagement (approaches and methods agreed with the client, a calculated value). Tell the client which one they are getting before work starts.
For startups issuing options, Section 409A regulations treat a value as presumptively reasonable when it comes from an independent appraisal dated no more than 12 months before the grant, under Treas. Reg. §1.409A-1. A model built for fundraising usually needs adjustment before it can support a 409A conclusion. Founders preparing for a raise can see how investors use these models in our post on fractional CFOs and fundraising.
Owners planning a sale should start fixing these well before a buyer appears. Our business exit strategy planning article covers the operational side of raising value before a transaction.
For a stable small company, capitalization of earnings or a short DCF, cross-checked against transaction multiples for similar businesses, usually gives the most defensible result. Asset-based value acts as a floor. Using two methods and reconciling the gap is more persuasive than relying on one.
Five years is common. Use longer periods only when the business has not yet reached steady state, such as a company still scaling margins. The forecast should end once growth and margins settle at sustainable levels.
There is no single rate. Build it from a dated risk-free rate, an equity risk premium, a size premium and a company-specific risk premium, then blend with after-tax debt cost. Document the source of each component so a reviewer can rebuild it.
Yes, as a market approach, and many deals are priced that way. Multiples assume the subject is comparable to the companies behind them, so adjust for size, growth and margin differences. A DCF is still useful for explaining why your company deserves a higher or lower multiple.
Gift and estate filings require a qualified appraisal by a qualified appraiser, and many CPAs hold credentials such as ABV or CVA. The IRS reviews these reports against its valuation guidelines, so the model and the report must explain every assumption.
Madras Accountancy supports US CPA firms with offshore staff who build and review valuation models: normalizing financials, building three-statement forecasts and DCFs, assembling comparable data and preparing sensitivity analysis under your firm's review. To scope a valuation or modeling engagement, contact our team.

The section 4960 excise tax is 21% of nonprofit pay over $1M. From 2026 it covers all employees. See the medical carve-outs, Form 4720 and a worked example.

The paid family and medical leave tax credit is permanent from 2026. See the 12.5% to 25% rates, the premium option, the 6-month rule and how Form 8994 works.

Opportunity zones become permanent in 2027 under the One Big Beautiful Bill. See the new deferral, rural bonus, and the 2026 handoff.