
Think of your financial statements as three different views of the same business. The Balance Sheet is a snapshot of what you own and owe. The Income Statement is a movie of your profitability over time. The Cash Flow Statement is a tracking of where your money goes. Master these three, and you'll have a complete picture of your business's financial health.
The balance sheet shows your business's financial position at a specific point in time. It's called a "balance sheet" because it must balance: Assets = Liabilities + Equity.
Assets are what you own, including current assets like cash, inventory, and accounts receivable, fixed assets like equipment, buildings, and vehicles, and intangible assets like patents, trademarks, and goodwill.
Liabilities are what you owe, including current liabilities like accounts payable and short-term debt, and long-term liabilities like mortgages and long-term loans.
Equity is what's left over, including owner's equity, retained earnings, and stock.
Current Ratio = Current Assets ÷ Current Liabilities. Above 2.0 is good liquidity, below 1.0 indicates potential cash flow problems.
Debt-to-Equity Ratio = Total Debt ÷ Total Equity. Lower is better and shows how much you're borrowing versus owning.
Quick Ratio = (Current Assets - Inventory) ÷ Current Liabilities. This is more conservative than current ratio and shows ability to pay bills without selling inventory.
Warning signs include current ratio below 1.0, high debt-to-equity ratio, declining cash position, growing accounts receivable, and increasing inventory levels.
The income statement shows your business's profitability over a specific period (month, quarter, or year). It tells you if you're making money and where it's coming from.
Revenue is your top line, including gross sales, service revenue, and other income. Cost of Goods Sold (COGS) includes direct costs of producing goods like materials, labor, and manufacturing costs.
Gross Profit = Revenue - COGS shows basic profitability before overhead and other expenses. Operating Expenses include rent, utilities, salaries, marketing, insurance, supplies, depreciation, and amortization.
Operating Income = Gross Profit - Operating Expenses shows profit from core operations before interest and taxes. Net Income = Operating Income - Interest - Taxes is your bottom line profit after everything.
Gross Profit Margin = Gross Profit ÷ Revenue shows basic profitability and is industry-specific. Operating Margin = Operating Income ÷ Revenue shows operational efficiency before interest and taxes. Net Profit Margin = Net Income ÷ Revenue shows overall profitability after all expenses.
Warning signs include declining gross margins, rising operating expenses, negative net income, inconsistent revenue, and high interest expenses.
The cash flow statement shows how cash moves in and out of your business. It's divided into three sections: Operating Activities include cash from day-to-day operations, collections from customers, and payments to suppliers and employees. Investing Activities include cash used for investments, equipment purchases, and asset sales. Financing Activities include cash from loans or investors, loan payments, and owner distributions.
Operating Cash Flow is cash generated from operations and is the most important metric showing business sustainability. Free Cash Flow = Operating Cash Flow - Capital Expenditures is cash available for growth after necessary investments. Cash Conversion Cycle is time from spending cash to collecting cash, where shorter is better and affects working capital needs.
Warning signs include negative operating cash flow, declining cash position, high capital expenditures, increasing accounts receivable, and difficulty collecting payments.
Profitability Analysis asks if you're making money, is profitability improving, and how do you compare to industry standards. Liquidity Analysis asks if you can pay your bills, do you have enough cash, and are you managing working capital well. Efficiency Analysis asks if you're using assets effectively, is your inventory turning over, and are you collecting receivables quickly.
Year-over-Year Comparison looks at if revenue is growing, are expenses under control, and is profitability improving. Seasonal Patterns examine if you have seasonal fluctuations, are you prepared for slow periods, and do you have cash reserves. Industry Benchmarking compares how you compare to competitors, are you above or below industry averages, and what areas need improvement.
Mixing Personal and Business means keeping business and personal finances separate, using separate bank accounts, and tracking business expenses properly. Poor Record-Keeping includes incomplete or inaccurate records, missing receipts and documentation, and inconsistent categorization. Ignoring Cash Flow means focusing only on profit, not managing working capital, and poor cash flow forecasting. Not Understanding Ratios means focusing on single numbers, not comparing to industry standards, and ignoring trends and patterns.
Growth Decisions ask can you afford to expand, do you need additional financing, and what's your break-even point. Investment Decisions ask should you buy new equipment, can you afford new hires, and what's the ROI on investments. Operational Decisions ask are your prices competitive, should you cut costs, and how can you improve efficiency.
Monthly Reviews track key metrics, identify trends early, and make timely adjustments. Quarterly Analysis provides comprehensive review, compare to budget, and update forecasts. Annual Planning sets goals and targets, creates budgets, and plans for growth.
Popular options include QuickBooks Online, Xero, Sage, and FreshBooks. Features to look for include real-time reporting, customizable dashboards, integration capabilities, and mobile access.
Excel and Spreadsheets provide custom calculations, trend analysis, scenario planning, and budgeting and forecasting. Business Intelligence Tools offer advanced analytics, automated reporting, data visualization, and predictive modeling.
Consider hiring help for complex transactions like multiple revenue streams, complex expense structures, inventory management, and regulatory compliance. Also consider help for growth and change including rapid business growth, new business ventures, tax planning needs, and financial analysis requirements.
Look for experience and expertise including relevant industry experience, financial analysis skills, technology proficiency, and communication abilities. Services offered should include bookkeeping and accounting, financial statement preparation, tax planning and preparation, and business advisory services.
Financial statements aren't just numbers on a page. They're the story of your business. They tell you where you've been, where you are, and where you're going. Master these documents, and you'll have the insights you need to make better decisions and grow your business.
The key is to start simple, focus on the basics, and gradually build your understanding. Don't try to learn everything at once, and don't be afraid to ask for help when you need it.
Ready to improve your financial management? Check out our comprehensive guide on In-House vs. Outsourced Accounting: A Cost-Benefit Analysis to understand your options.
For insights on common accounting mistakes to avoid, read our article on Common Small Business Accounting Mistakes to Avoid.
And if you're ready to take the next step, our guide on How to Choose an Accounting Outsourcing Provider: 10 Questions to Ask will help you select the right partner.
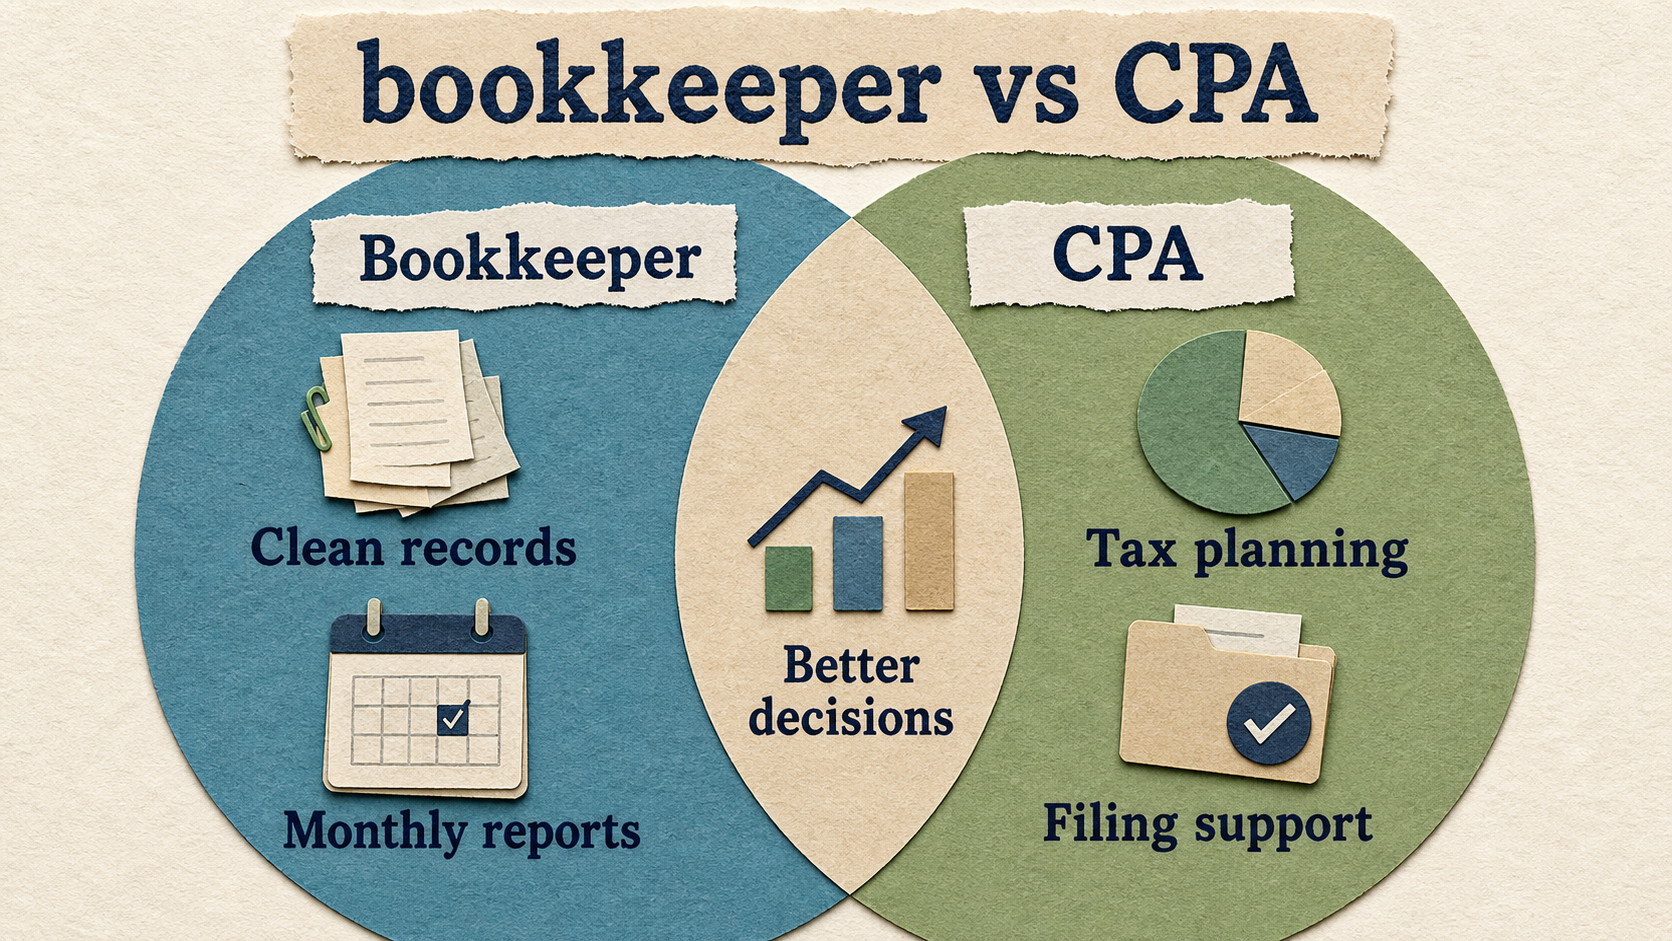
Compare a bookkeeper and CPA so your business knows when it needs recordkeeping, tax filing, planning, or higher-level advice.
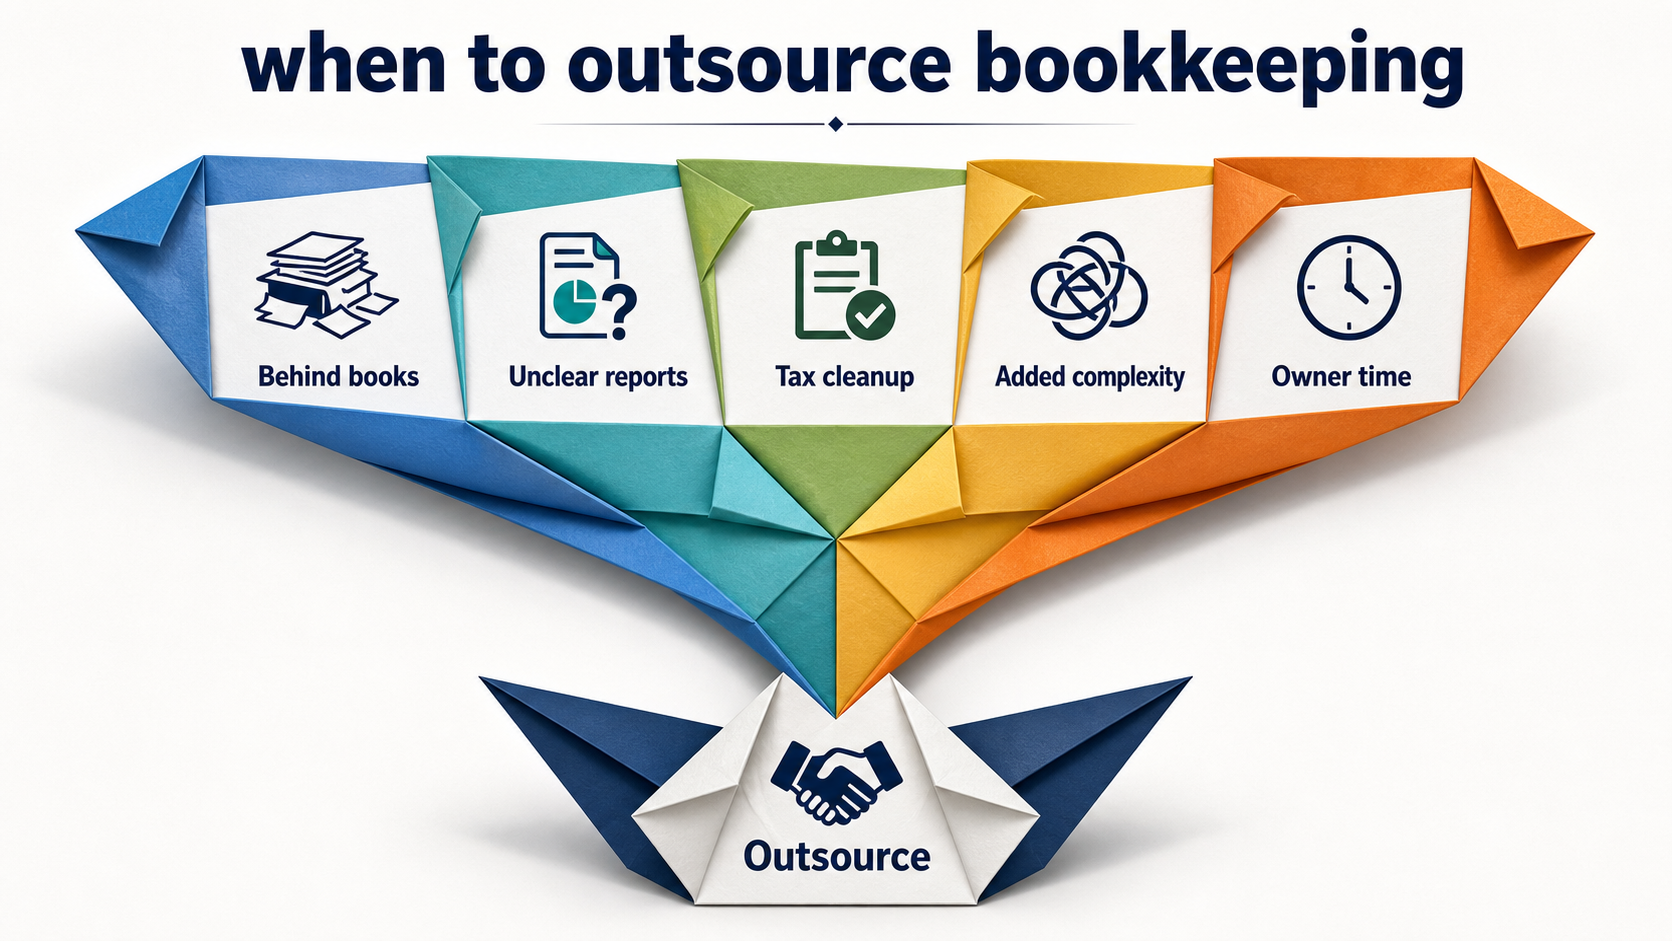
Learn when to outsource bookkeeping, what tasks to hand off first, and how outsourced bookkeeping supports tax planning and decisions.
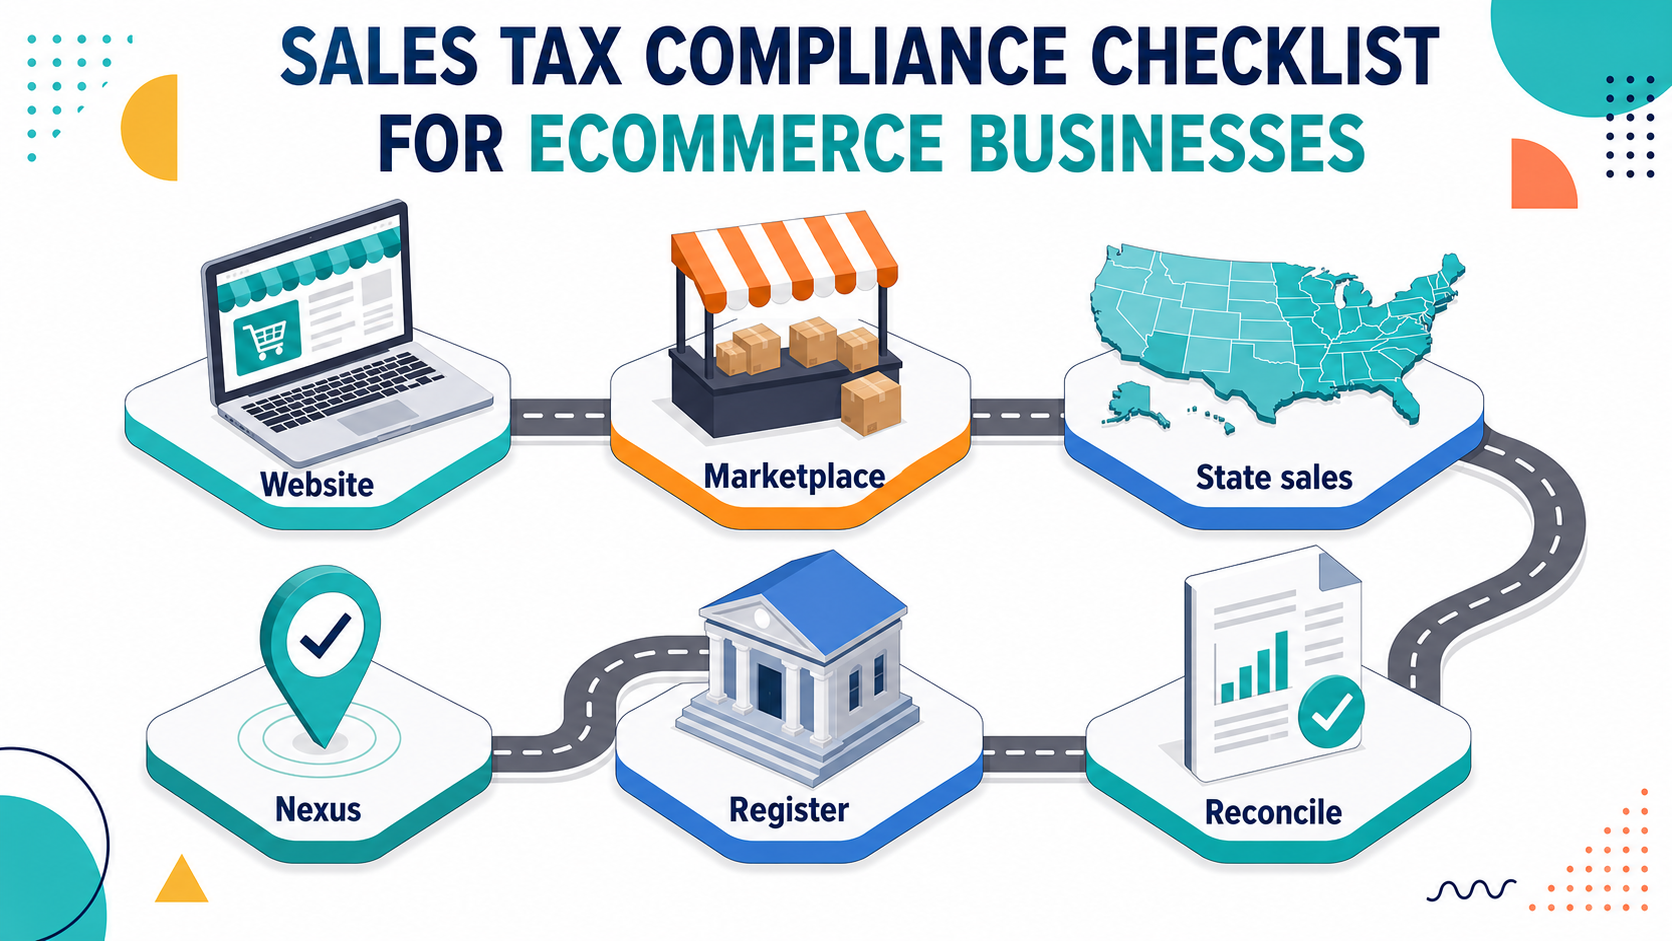
Use this ecommerce sales tax checklist to review nexus, registrations, marketplaces, product taxability, filings, and bookkeeping records.