.png)

Managing a professional service firm without proper KPI tracking is like trying to navigate without a compass. You might eventually reach your destination, but you'll waste time, resources, and opportunities along the way. In today's competitive landscape, service organizations need clear visibility into their performance metrics to make data-driven decisions that drive sustainable growth.
The challenge most consulting firms and service organizations face isn't a lack of data - it's knowing which metrics actually matter for their business success. With countless potential KPIs to track, many firms end up measuring everything and understanding nothing, creating reports that overwhelm rather than inform decision-making.
The key to effective KPI reporting lies in selecting metrics that directly connect to your firm's strategic objectives and operational realities. The right professional services KPIs provide early warning signals about potential problems while highlighting opportunities for improvement and growth.
Understanding which KPIs to track, how to measure them accurately, and how to turn insights into action can transform your service firm from reactive to proactive, giving you the competitive edge needed to thrive in challenging markets.
Revenue per employee stands as one of the most fundamental metrics for professional service firms because it directly reflects how effectively you're monetizing your human capital. This KPI helps you understand whether your pricing strategies and utilization rates are generating appropriate returns on your biggest investment - your people.
Calculating revenue per employee requires dividing total revenue by the number of full-time equivalent employees, but the real value comes from tracking trends over time and comparing performance across different service lines or teams. High-performing consulting firms typically see consistent growth in this metric through improved efficiency, better pricing, or enhanced service offerings.
Billable hour realization rates reveal how much of your theoretical capacity you're actually converting into revenue. This metric goes beyond simple utilization to show whether your billing processes are capturing all the value your team creates. Poor realization rates often indicate problems with time tracking, billing procedures, or client communication about scope changes.
Average project margin provides insight into the profitability of your service delivery model. Track this metric both at the project level and across service lines to identify which types of engagements generate the strongest returns and which might need pricing or delivery adjustments.
Days sales outstanding (DSO) measures how quickly you're converting completed work into actual cash flow. For professional service firms, maintaining healthy cash flow is critical because your primary costs - employee salaries and benefits - occur regardless of when clients pay their invoices.
Effective DSO management requires tracking not just the average collection period, but also aging analysis that shows how many invoices are overdue and by how long. Many service firms find that focusing on reducing their longest outstanding receivables has a bigger impact than trying to accelerate all collections uniformly.
Invoice approval and processing time affects both client satisfaction and cash flow. Track how long it takes from project completion to invoice delivery, and monitor any bottlenecks in your billing approval process that might delay payment collection.
Write-off rates indicate both billing accuracy and client satisfaction issues. High write-off rates might suggest problems with project scoping, change order management, or service delivery quality that need operational attention.
Billable utilization rate represents the percentage of available time that employees spend on revenue-generating activities. While this seems straightforward, calculating meaningful utilization rates requires careful definition of what constitutes "available" time and "billable" activities.
Most successful professional service firms target utilization rates between 65-85%, depending on their service model and employee roles. Higher rates might indicate insufficient investment in business development, training, or administrative support, while lower rates suggest capacity management or business development challenges.
Track utilization at multiple levels - individual, team, service line, and firm-wide - to identify patterns and opportunities for improvement. Individual utilization data helps with performance management and capacity planning, while aggregate data informs strategic decisions about hiring, service offerings, and market focus.
Resource allocation efficiency measures how well you're matching employee skills and availability with client needs. This KPI becomes particularly important for firms with specialized expertise or geographic distribution where misallocation can significantly impact both utilization and service quality.
Project profitability analysis goes beyond simple revenue tracking to understand the true cost and margin of different types of engagements. This analysis should include direct labor costs, project-specific expenses, and allocated overhead to provide accurate profitability insights.
Effective project profitability tracking requires integrated systems that capture both time and expenses accurately while providing real-time visibility into project performance. Many firms find that monthly project reviews using profitability data help identify issues early enough to take corrective action.
Project completion metrics track both timeline adherence and budget performance across your engagements. Consistent delays or budget overruns might indicate systemic issues with project scoping, resource planning, or change management processes.
Scope change frequency and impact measurement helps you understand whether projects are being defined clearly enough upfront or whether your change management processes are capturing additional value appropriately.
Client satisfaction scores provide leading indicators of future business performance, but effective measurement requires systematic feedback collection that goes beyond end-of-project surveys. Regular pulse surveys during engagements can identify issues early enough to address them proactively.
Net Promoter Score (NPS) specifically measures client willingness to recommend your services, which correlates strongly with repeat business and referral generation. Track NPS trends over time and by service line to identify areas of strength and opportunities for improvement.
Client retention rates reveal the health of your ongoing relationships and the quality of your service delivery. Calculate retention rates both by number of clients and by revenue to understand whether you're maintaining relationships with your most valuable accounts.
Repeat business percentage shows what portion of your revenue comes from existing clients versus new business development. While new client acquisition is important for growth, high repeat business rates typically indicate strong client satisfaction and more efficient business development.
Pipeline health metrics track the quantity and quality of potential new engagements across different stages of your sales process. Monitor not just the total value of your pipeline, but also conversion rates at each stage and average sales cycle length.
Proposal win rate indicates the effectiveness of your business development efforts and competitive positioning. Track win rates by service line, client type, and proposal value to identify patterns that can inform your go-to-market strategy.
Revenue growth rate should be analyzed both in absolute terms and relative to market conditions and competitive performance. Sustainable growth typically requires balance between new client acquisition and expansion of existing client relationships.
Client concentration risk measurement helps you understand dependency on major clients that could significantly impact your firm if relationships change. Most consulting firms try to ensure that no single client represents more than 15-20% of total revenue.
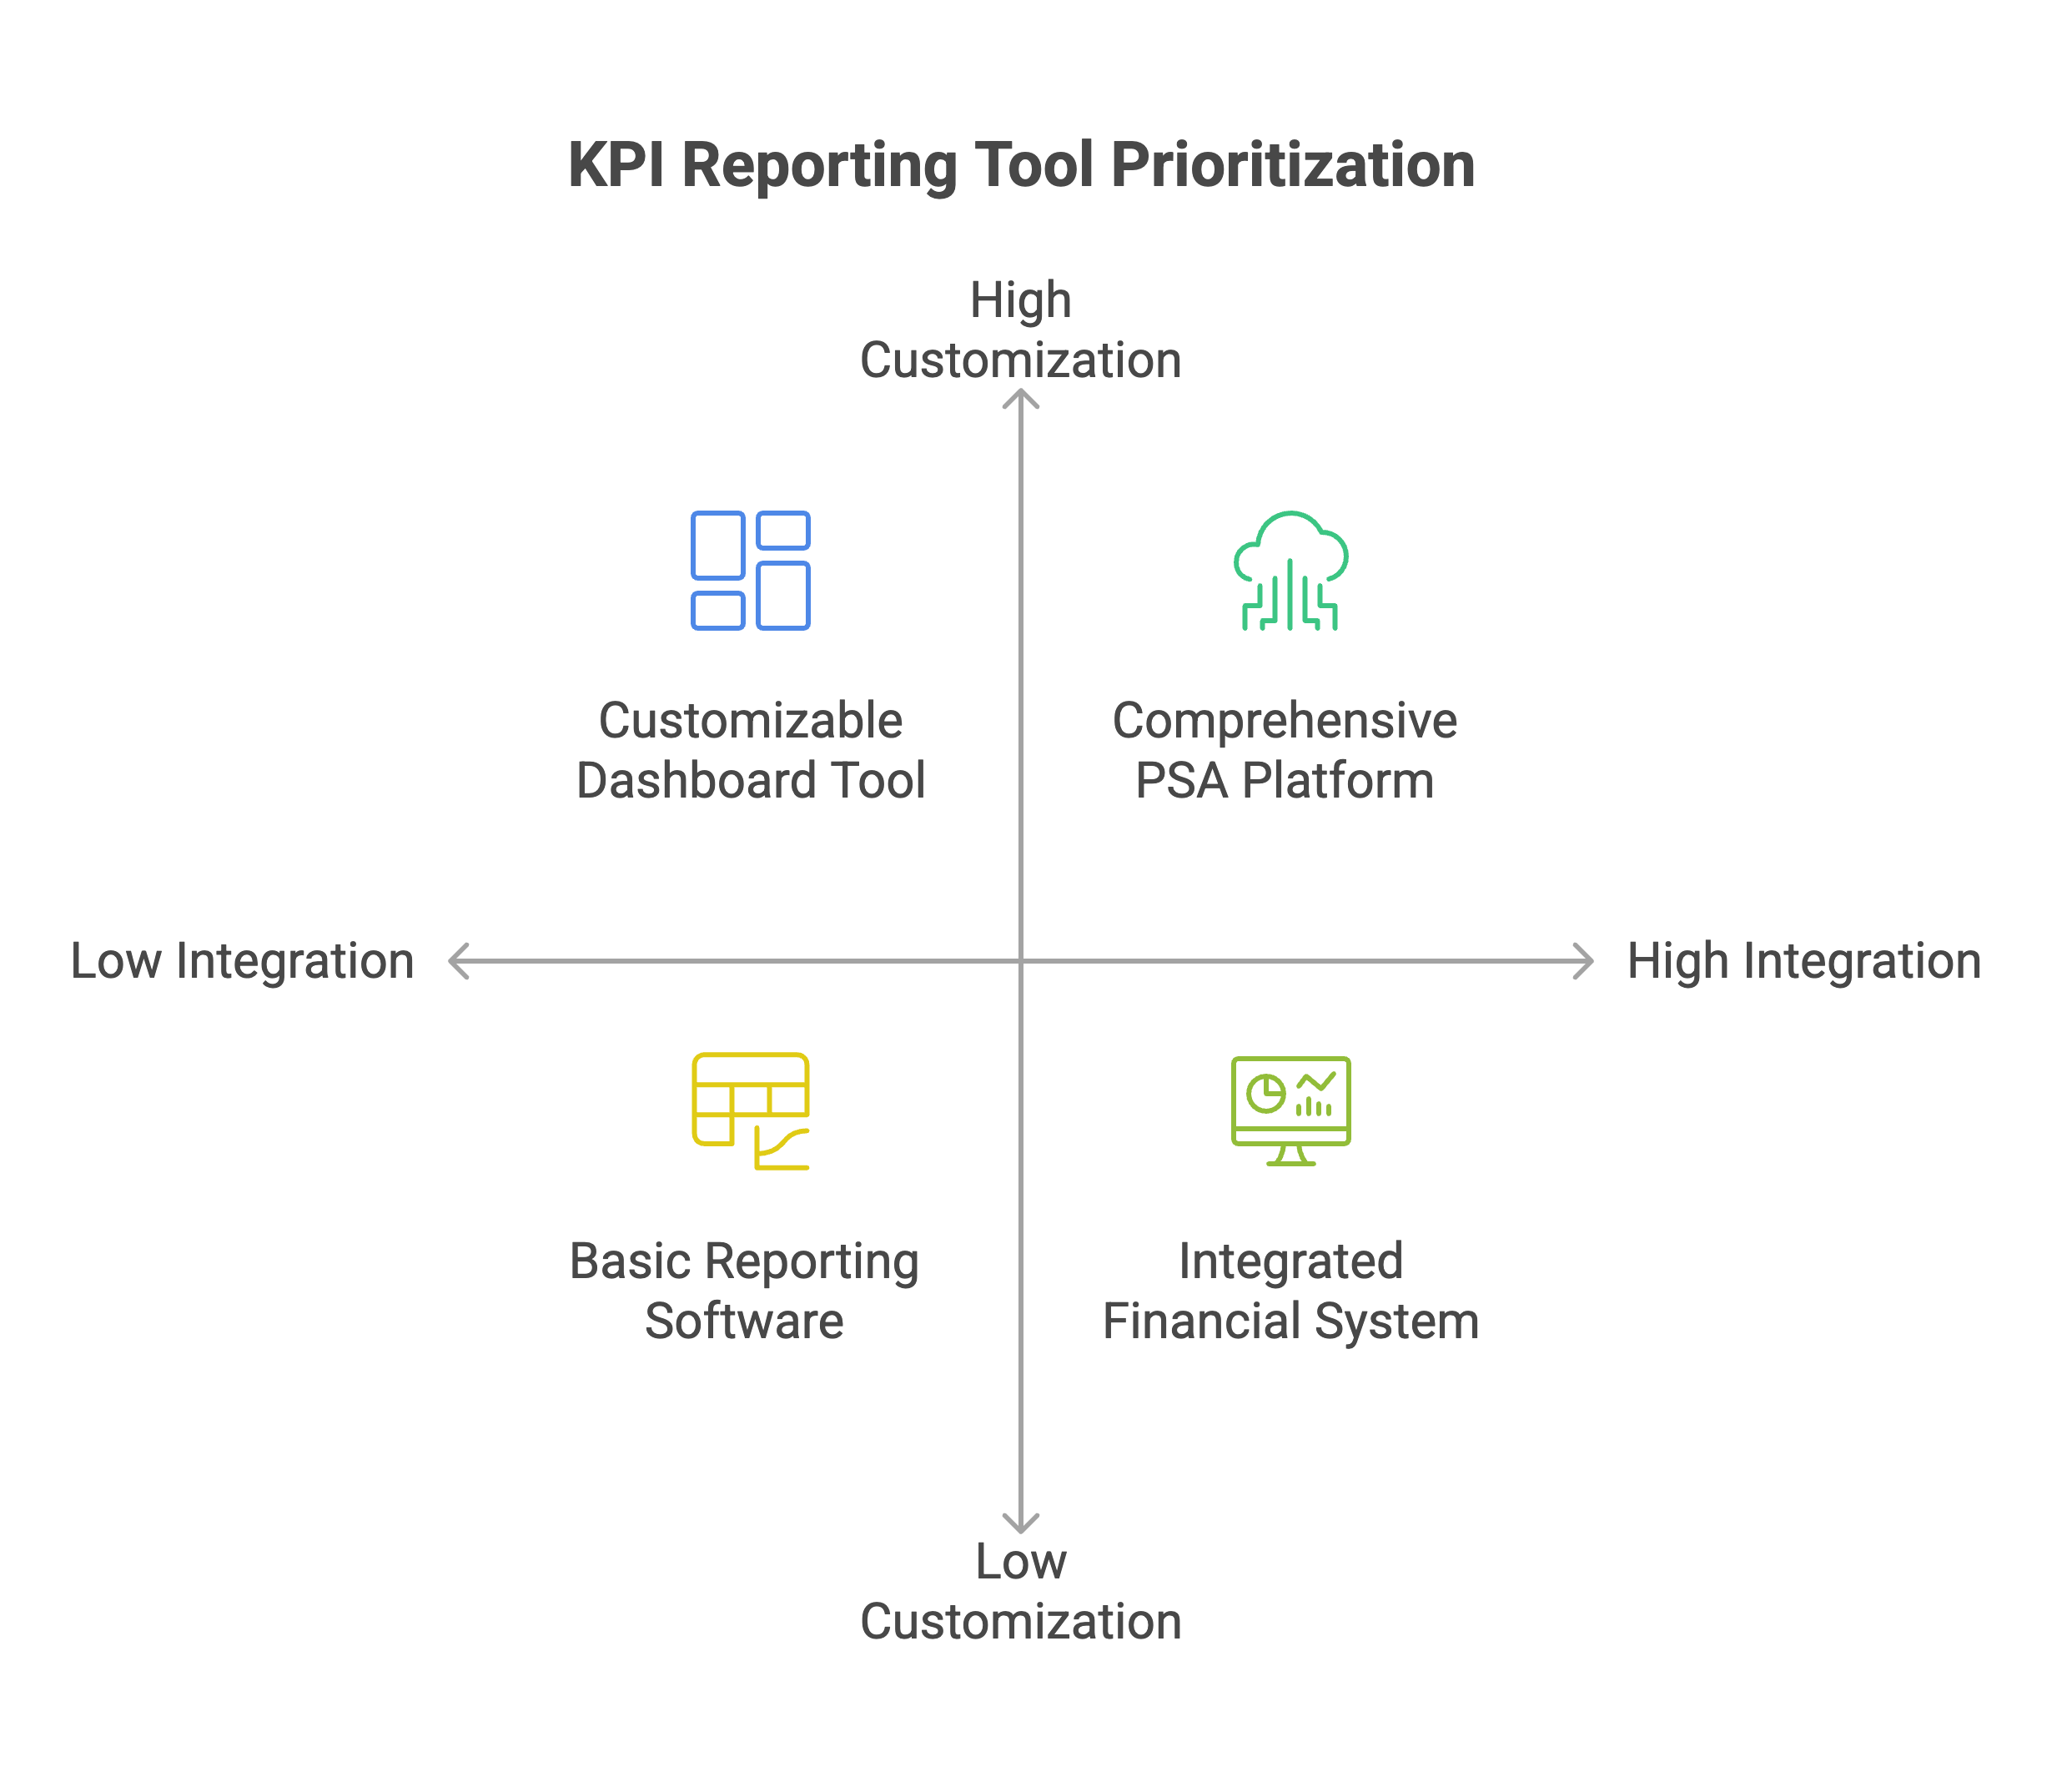
Modern professional services automation software integrates project management, time tracking, resource planning, and financial reporting to provide comprehensive KPI visibility. These platforms eliminate many of the manual processes that make KPI tracking time-consuming and error-prone.
When selecting KPI reporting tools, prioritize solutions that integrate with your existing systems and provide real-time data visibility rather than requiring manual data compilation. The best tools offer customizable dashboards that allow different stakeholders to focus on the metrics most relevant to their roles.
Time and project management tools should capture not just billable time, but also the context that makes utilization data meaningful. This includes project phases, task types, and service categories that help you understand how time is being allocated across different activities.
Financial integration capabilities ensure that your KPI reporting reflects actual financial performance rather than just operational activities. Integration with accounting systems provides the financial context needed to make utilization and project data actionable.
Effective KPI dashboards present information in ways that support quick decision-making while providing drill-down capabilities for deeper analysis. Avoid cluttered presentations that try to show every metric on a single screen - focus on the most important indicators with clear visual hierarchy.
Real-time updating capabilities help ensure that your KPI reports reflect current business conditions rather than outdated information. However, balance real-time data with appropriate context - some metrics are more meaningful when viewed over longer time periods.
Mobile accessibility becomes important when key stakeholders need access to performance data while traveling or working remotely. Ensure that your KPI reporting works effectively on mobile devices without sacrificing functionality or readability.
Automated alerting can help ensure that significant changes in key metrics get appropriate attention quickly. Set up notifications for metrics that fall outside acceptable ranges or show concerning trends that require immediate action.
Start with a focused set of core KPIs rather than trying to track everything from the beginning. Most successful professional service firms find that 8-12 key metrics provide sufficient insight without creating information overload that reduces decision-making effectiveness.
Align your KPI selection with your firm's strategic objectives and operational model. A firm focused on rapid growth needs different metrics than one emphasizing profitability optimization or client satisfaction excellence.
Involve key stakeholders in metric selection to ensure buy-in and relevance. The metrics you track should support decisions that these stakeholders need to make, and they should understand how their actions influence the results.
Plan for metric evolution as your firm grows and changes. The KPIs that are most important for a 25-person firm might not be the same ones that drive success for a 250-person organization.
Establish regular reporting cycles that provide timely information without overwhelming recipients with too frequent updates. Monthly reporting works well for most operational metrics, while strategic KPIs might be reviewed quarterly.
Include context and analysis with your KPI reports rather than just presenting raw numbers. Help stakeholders understand what the metrics mean, why they're changing, and what actions might be appropriate based on the results.
Create clear ownership and accountability for each KPI to ensure that someone is responsible for monitoring performance and taking action when needed. This ownership should include both the measurement process and the business outcomes the metrics represent.
Document your KPI definitions, calculation methods, and data sources to ensure consistency over time and across different report users. This documentation becomes particularly important as your team grows or changes.
Use KPI data to identify trends and patterns rather than just monitoring current performance. Trend analysis often provides more actionable insights than point-in-time measurements.
Benchmark your performance against industry standards and best practices when possible. Understanding how your metrics compare to similar firms helps contextualize your results and identify improvement opportunities.
Connect KPI performance to individual and team objectives to ensure that operational metrics translate into behavior changes. People tend to focus on what gets measured and rewarded.
Regular review meetings focused on KPI results help ensure that insights translate into action. These meetings should focus on understanding why metrics are changing and what strategic or operational adjustments might be needed.
Q: What are the most important KPIs for professional services firms to track? A: Essential KPIs include billable utilization rate, revenue per employee, project profitability, client satisfaction scores, and cash flow metrics like days sales outstanding. The specific mix should align with your firm's strategic priorities and operational model.
Q: How often should professional services KPIs be reviewed and reported? A: Most operational KPIs benefit from monthly review, while strategic metrics can be evaluated quarterly. Financial performance metrics often require monthly tracking, but trend analysis over 3-6 month periods provides better insights for decision-making.
Q: What's a good target utilization rate for consulting firms? A: Most successful consulting firms target 65-85% billable utilization, with variations based on role and seniority. Senior partners might have lower utilization due to business development responsibilities, while project staff typically target higher rates.
Q: How do you measure ROI on professional services automation tools? A: Calculate ROI by comparing the cost of automation tools against time savings, improved billing accuracy, better resource utilization, and reduced administrative overhead. Most firms see positive ROI within 6-12 months through improved efficiency and billing capture.
Q: What's the difference between utilization rate and realization rate? A: Utilization rate measures the percentage of available time spent on billable activities, while realization rate measures the percentage of recorded billable time that actually gets converted into revenue. Both metrics are important for understanding revenue generation efficiency.
Q: How can small professional services firms implement KPI tracking without dedicated resources? A: Start with basic metrics using existing tools like project management software and accounting systems. Focus on 3-5 key metrics initially, and gradually expand tracking capabilities as the firm grows. Many cloud-based tools offer affordable KPI reporting for smaller firms.
Q: What benchmarks should professional services firms use for their KPIs? A: Industry associations, consulting publications, and peer networks provide benchmarking data. However, focus more on your own performance trends over time rather than absolute comparisons, as business models and market conditions vary significantly across firms.
Q: How do you ensure KPI data accuracy and reliability? A: Implement consistent data collection processes, provide training on time tracking and project reporting, establish clear metric definitions, and conduct regular data quality reviews. Integration between systems reduces manual data entry errors that can compromise accuracy.
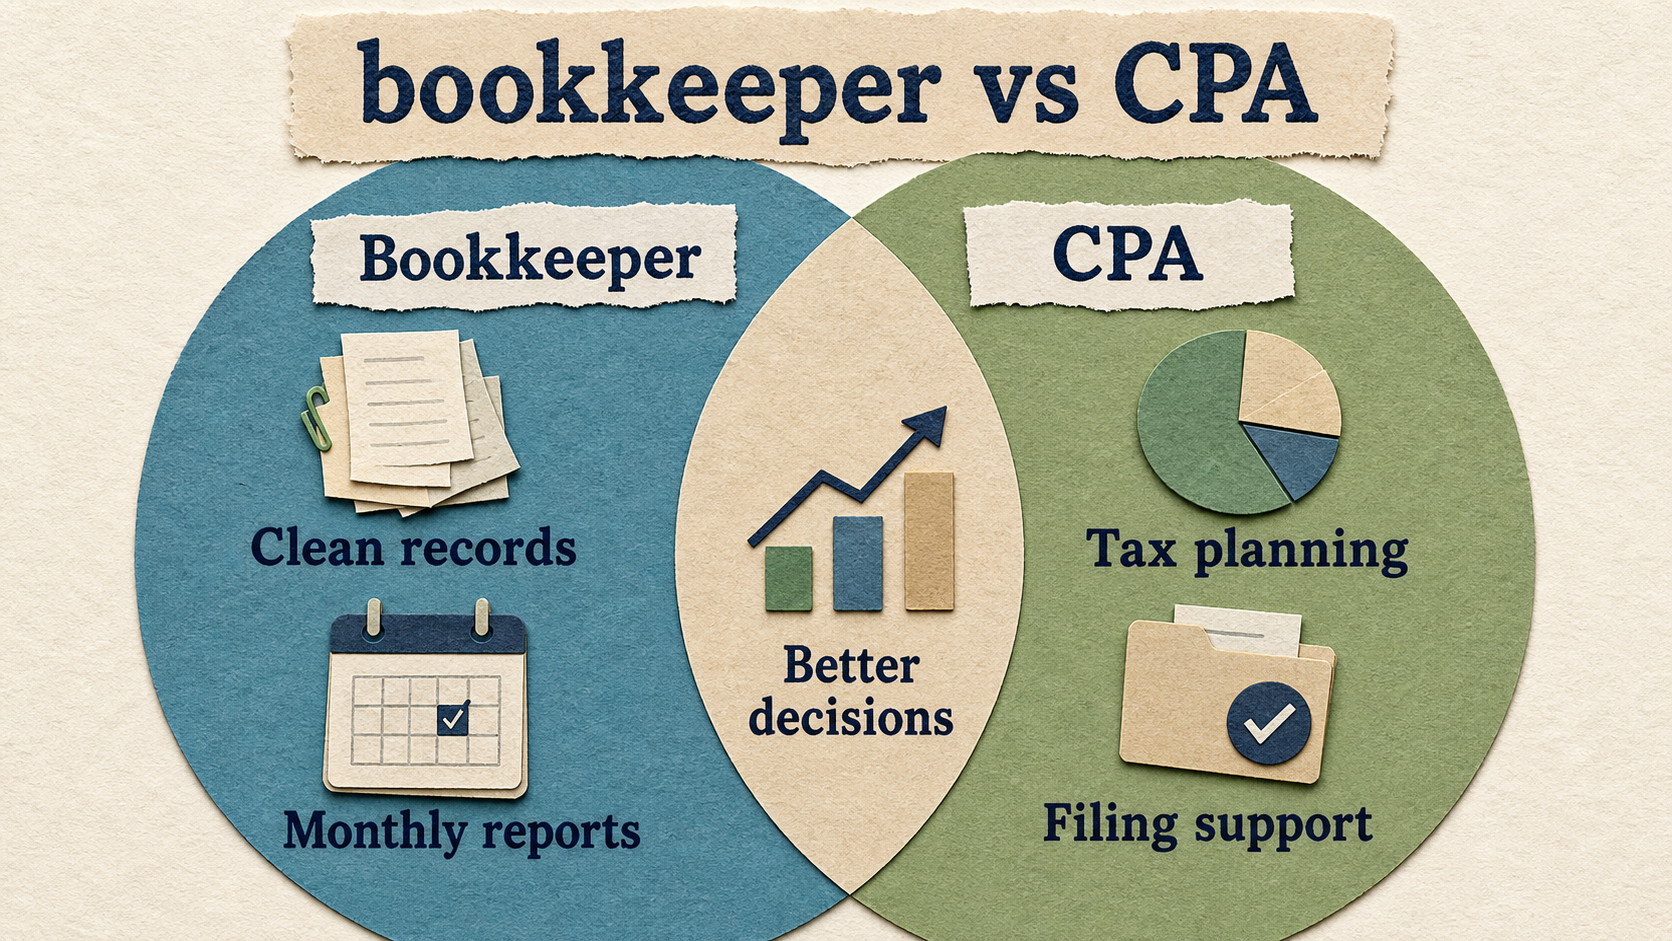
Compare a bookkeeper and CPA so your business knows when it needs recordkeeping, tax filing, planning, or higher-level advice.
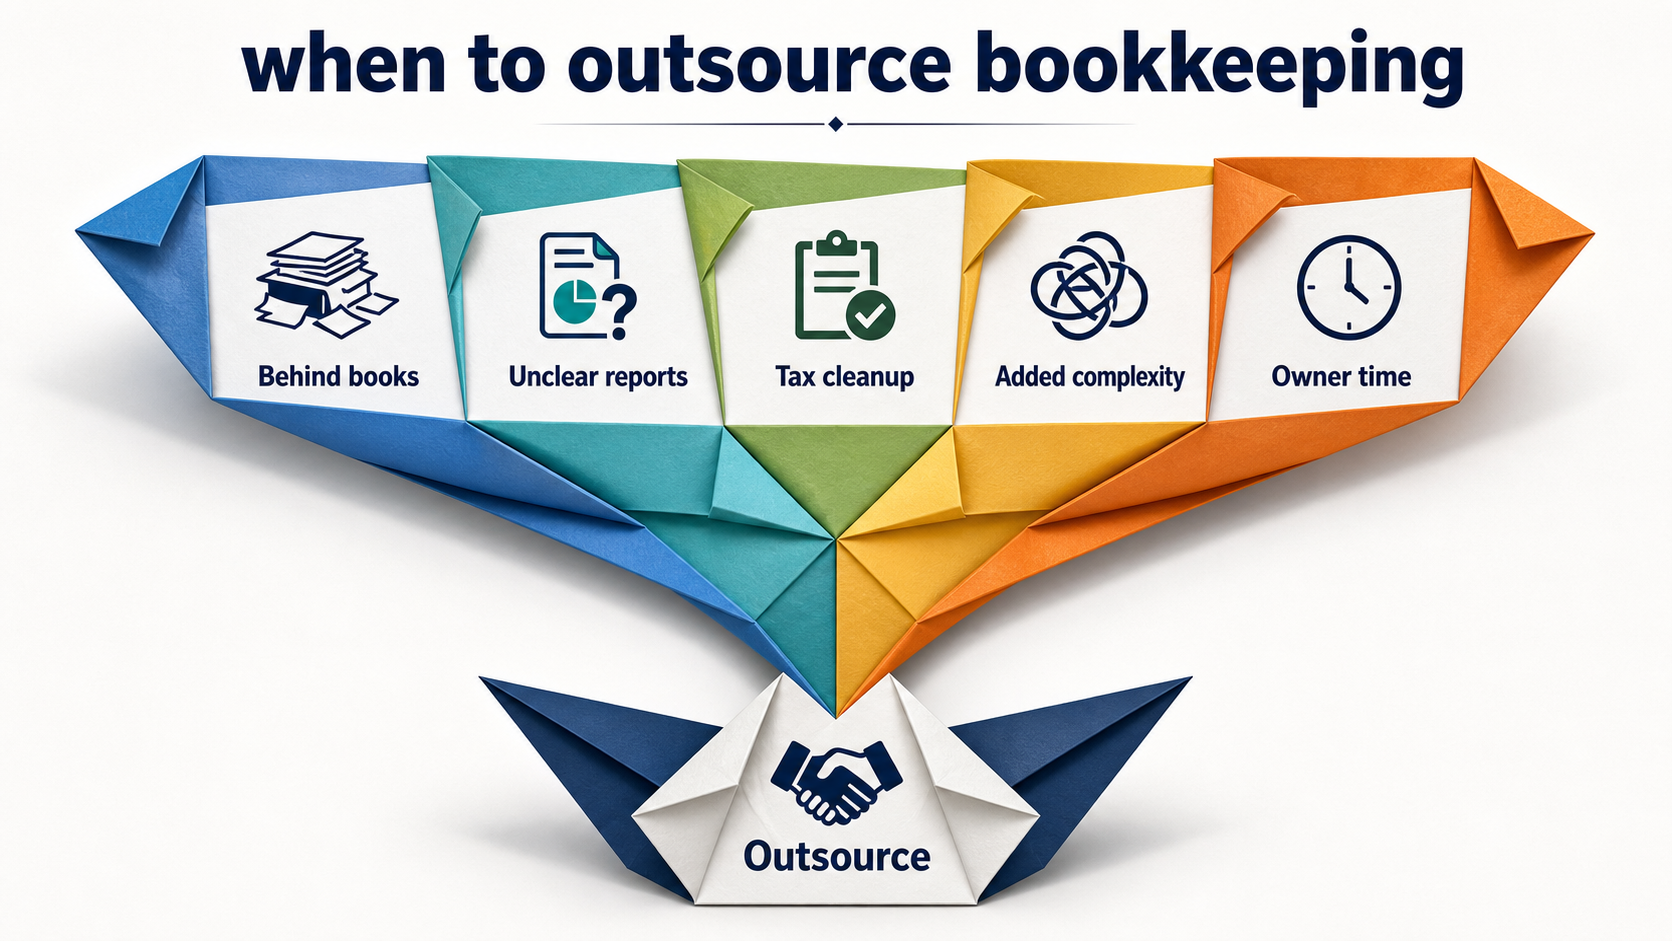
Learn when to outsource bookkeeping, what tasks to hand off first, and how outsourced bookkeeping supports tax planning and decisions.
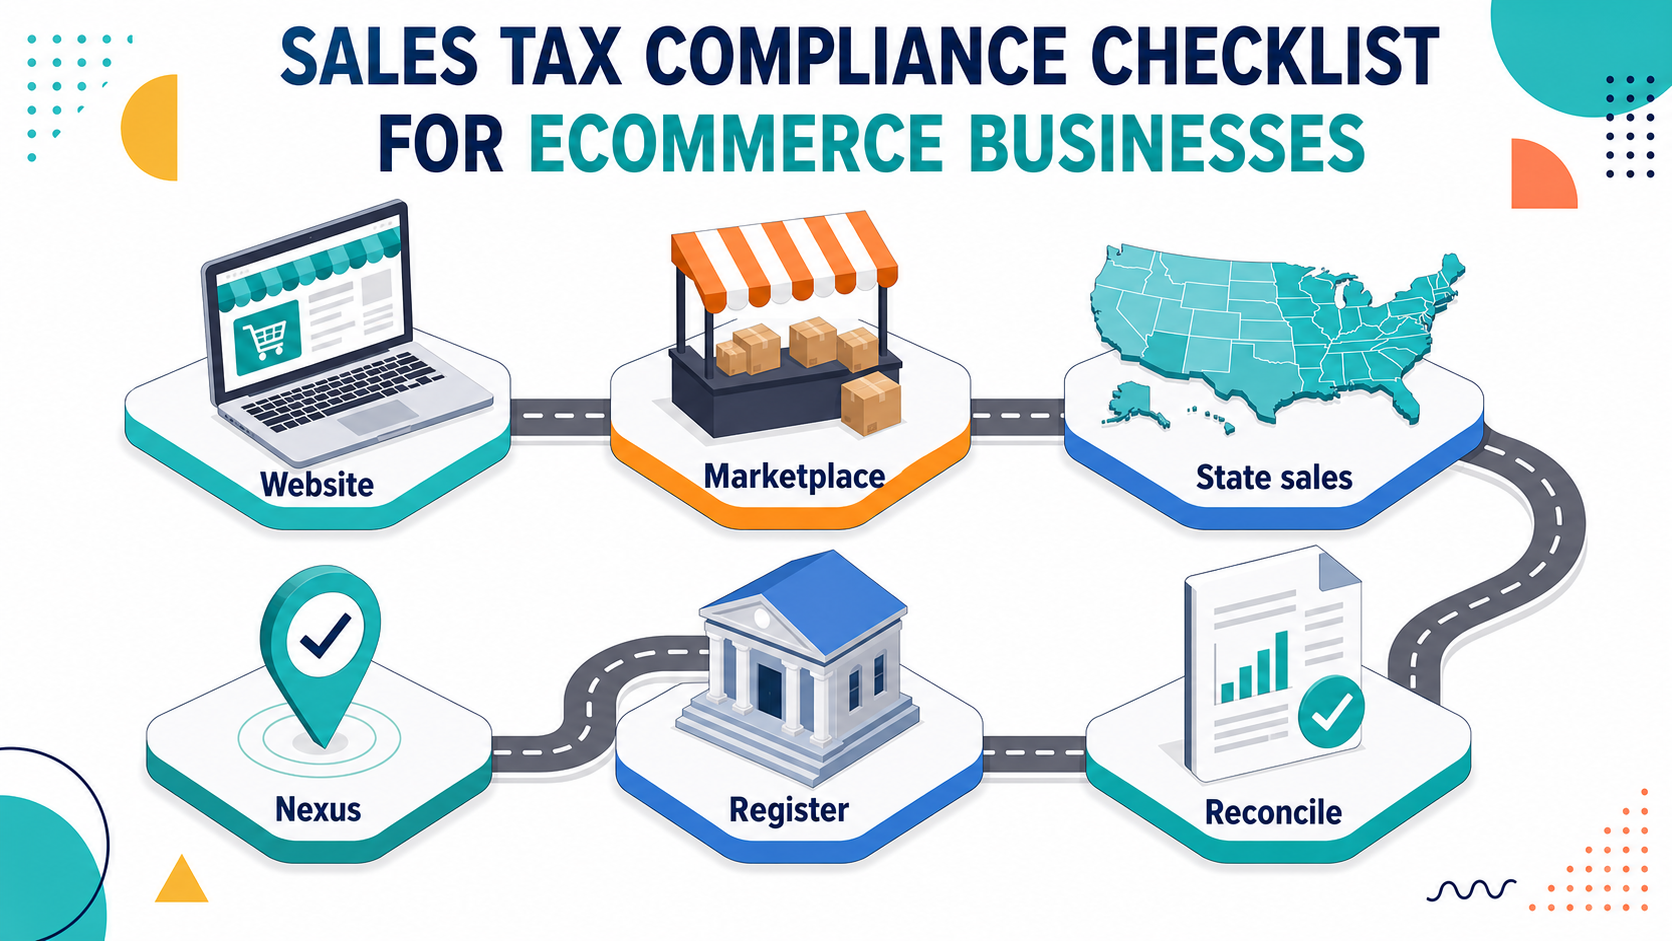
Use this ecommerce sales tax checklist to review nexus, registrations, marketplaces, product taxability, filings, and bookkeeping records.