.png)

Creating effective management report packages isn't just about compiling financial data into a PDF and sending it to executives. The best management reporting packages tell a clear story about business performance while providing the specific insights leaders need to make informed strategic decisions.
Too many organizations create management reports that sit unread in email inboxes because they're either too detailed, poorly organized, or don't address the questions that actually matter to decision-makers. The key to successful management reporting lies in understanding what your audience needs to know and presenting that information in a format that supports quick understanding and action.
A well-structured management report package serves as the communication bridge between operational performance and strategic decision-making. It should highlight both successes and challenges while providing context that helps leadership understand what's driving results and what actions might be needed.
The most effective management reporting packages combine quantitative data with qualitative insights, creating a comprehensive view of business performance that supports both operational oversight and strategic planning activities.
The executive summary serves as the most critical section of any management report package. This section should distill the most important business insights into a concise overview that busy executives can review quickly to understand overall performance trends.
Your executive summary should highlight the three to five most significant developments during the reporting period, whether positive or negative. These might include major revenue wins, operational challenges, market changes, or strategic initiative progress. Each point should be specific and quantified wherever possible.
Key performance indicators (KPIs) presentation requires careful selection and clear visualization. Focus on metrics that directly influence business success rather than reporting every available data point. Most effective management reports track 8-12 core KPIs that provide a balanced view of financial performance, operational efficiency, and strategic progress.
Dashboard-style presentations work well for KPI sections because they allow readers to quickly spot trends and identify areas requiring attention. Use charts and graphs to highlight performance relative to targets, prior periods, or industry benchmarks.
Financial data forms the backbone of most management report packages, but raw numbers without context provide limited value. Effective financial reporting combines key financial statements with analysis that explains what's driving results and what trends mean for future performance.
Income statement highlights should focus on revenue trends, margin analysis, and significant expense variances. Rather than presenting every line item, summarize performance by major categories and provide commentary on unusual items or significant changes from expectations.
Balance sheet analysis typically focuses on working capital management, debt levels, and cash position. These metrics are particularly important for understanding financial health and liquidity position. Include trend analysis that shows how key balance sheet ratios are changing over time.
Cash flow reporting deserves special attention because cash flow problems often develop before they're reflected in other financial metrics. Present both operating cash flow trends and forward-looking cash flow projections that help leadership understand liquidity needs.
Operational reporting provides insights into the business activities that drive financial results. These metrics help management understand whether current performance trends are sustainable and what operational changes might be needed to achieve strategic goals.
Sales performance metrics should go beyond just revenue numbers to include pipeline analysis, customer acquisition data, retention rates, and sales efficiency measures. This information helps leadership understand whether revenue growth is sustainable and what investments might be needed to maintain momentum.
Production or service delivery metrics depend on your business model but typically include efficiency measures, quality indicators, and capacity utilization data. These metrics help identify operational constraints that might limit future growth or areas where process improvements could enhance profitability.
Customer satisfaction and employee engagement metrics provide leading indicators of future performance. These qualitative measures often predict future financial results and help identify potential issues before they impact revenue or profitability.
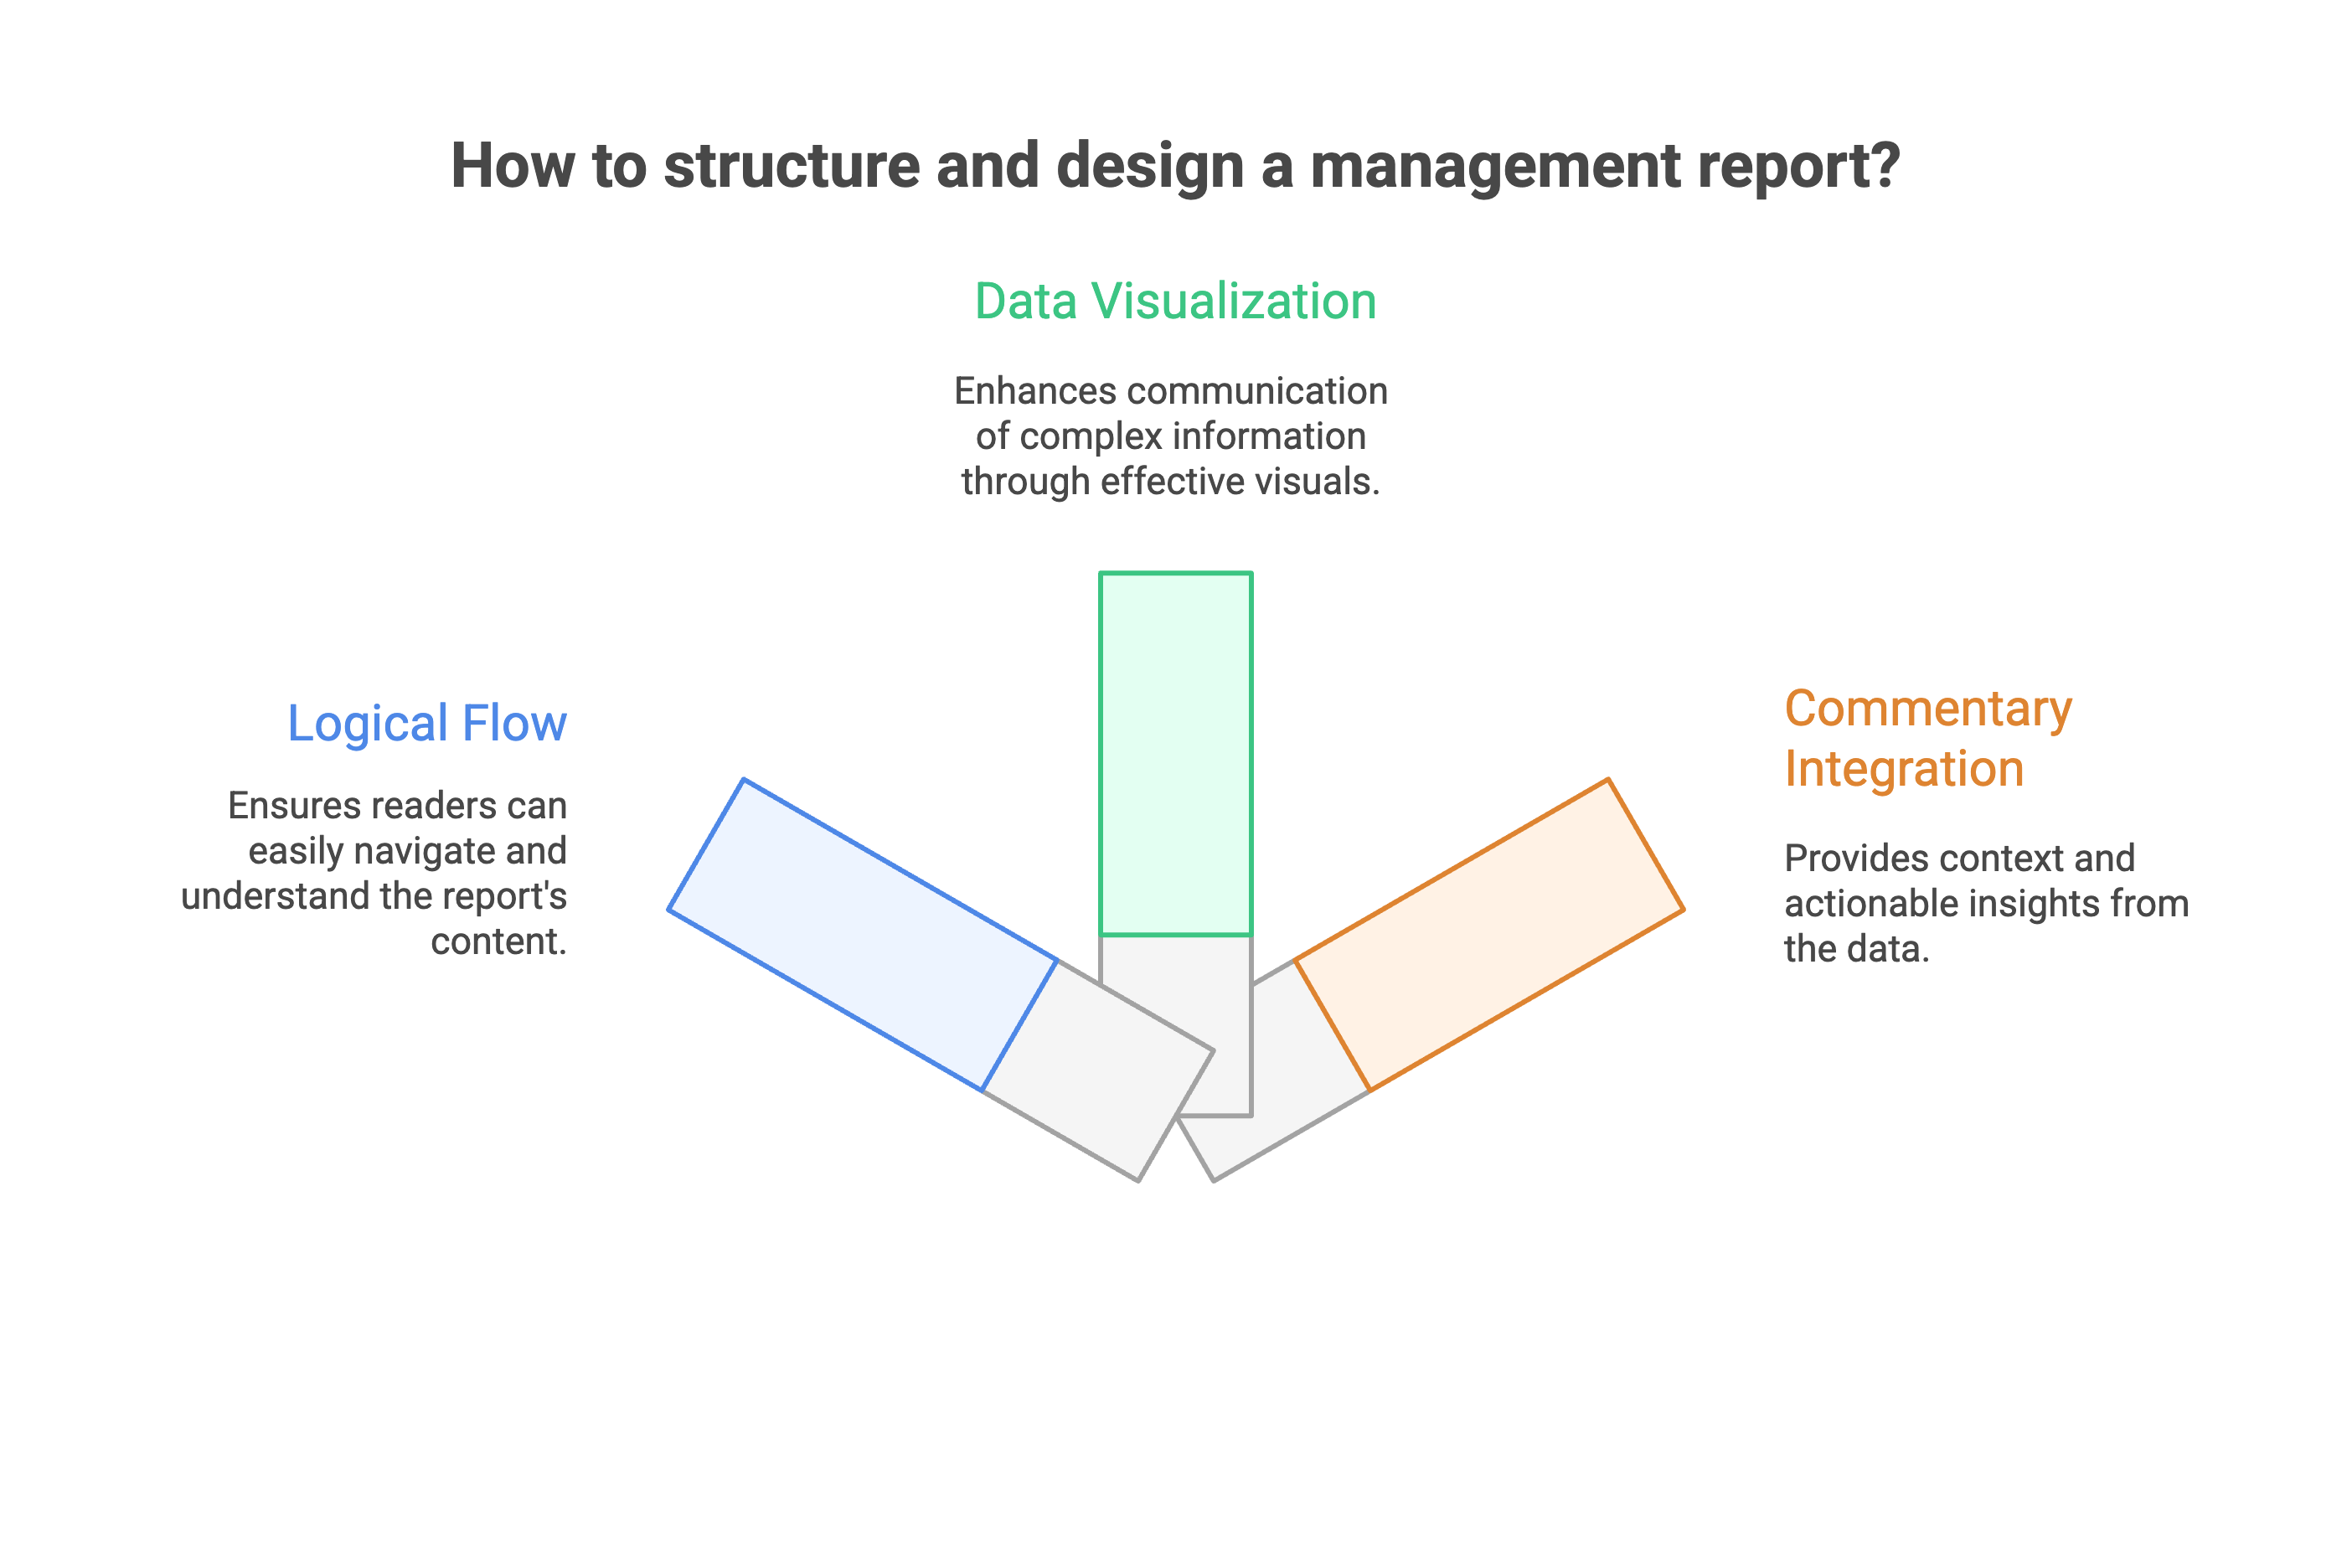
Effective management report packages follow a logical structure that guides readers through information in order of importance and relevance. Start with high-level summaries and gradually provide more detailed information for readers who need deeper analysis.
The table of contents should clearly indicate what information is available and where to find it. Many executives will only read certain sections, so make it easy for them to locate relevant information quickly. Consider using consistent section numbering and page references.
Visual hierarchy helps readers navigate complex information efficiently. Use consistent formatting, headers, and spacing to create clear information sections. Important insights should be highlighted through callout boxes, bold text, or other visual techniques that draw attention.
Page layout considerations include avoiding information overload on any single page while ensuring related information appears together. Use white space effectively to create readable presentations that don't overwhelm busy executives.
Charts and graphs can communicate complex information much more effectively than tables of numbers, but only when designed properly. Choose visualization types that match your data characteristics and the insights you want to communicate.
Trend lines work well for showing performance over time, while bar charts effectively compare performance across different categories or business units. Pie charts should be used sparingly and only when showing parts of a whole relationship.
Color usage should be consistent throughout the report package and should support rather than distract from the information being presented. Use colors strategically to highlight important information or to group related data points.
Data labels and axis formatting must be clear and complete. Avoid abbreviations that might confuse readers and always include units of measurement. Consider your audience's familiarity with financial terminology when labeling charts and graphs.
Numbers alone don't tell the complete story. Effective management reports include commentary that explains what's behind the data and what it means for future business performance. This analysis transforms raw data into actionable business intelligence.
Variance explanations should address significant differences from budget, forecast, or prior period performance. Focus on variances that are both material in size and controllable by management actions. Explain both what happened and why it happened.
Forward-looking analysis helps management understand trends and anticipate future challenges or opportunities. This might include discussion of seasonal factors, market trends, competitive dynamics, or internal initiatives that will affect future performance.
Action item identification transforms analysis into concrete next steps. When reports identify problems or opportunities, suggest specific actions that management might consider to address the situation.
Monthly financial packages typically include income statements, balance sheets, and cash flow statements, along with budget variance analysis and key ratio calculations. These reports provide the foundation for understanding overall business performance.
Profitability analysis reports break down margins by product line, customer segment, or business unit to help identify the most profitable areas of the business. This analysis supports pricing decisions and resource allocation priorities.
Cash flow forecasting reports project future cash needs based on current performance trends and known commitments. These reports are particularly important for businesses with seasonal fluctuations or significant capital investment requirements.
Budget and forecast updates provide revised projections based on current performance trends and changed assumptions. These reports help leadership understand whether original plans remain achievable or need adjustment.
Sales performance reports track revenue trends, pipeline development, customer acquisition, and sales team productivity. These reports help identify whether current sales processes and resources can support growth targets.
Production or service delivery reports monitor efficiency, quality, and capacity utilization metrics that drive operational success. These reports help identify bottlenecks and improvement opportunities.
Customer satisfaction and retention reports provide insights into customer relationships that often predict future revenue trends. These metrics help identify service issues before they affect financial performance.
Inventory management reports track stock levels, turnover rates, and obsolescence risks for businesses carrying significant inventory. These reports support working capital optimization and operational efficiency.
Project status reports track progress on major strategic initiatives, including timeline adherence, budget performance, and milestone achievement. These reports help ensure that important projects stay on track.
Market analysis reports provide external context for business performance, including competitive intelligence, industry trends, and regulatory changes that might affect future performance.
Risk management reports identify and assess business risks while tracking mitigation efforts. These reports help leadership anticipate and prepare for potential challenges.
Performance against strategic goals reports measure progress toward long-term objectives and help identify whether current activities are aligned with strategic priorities.
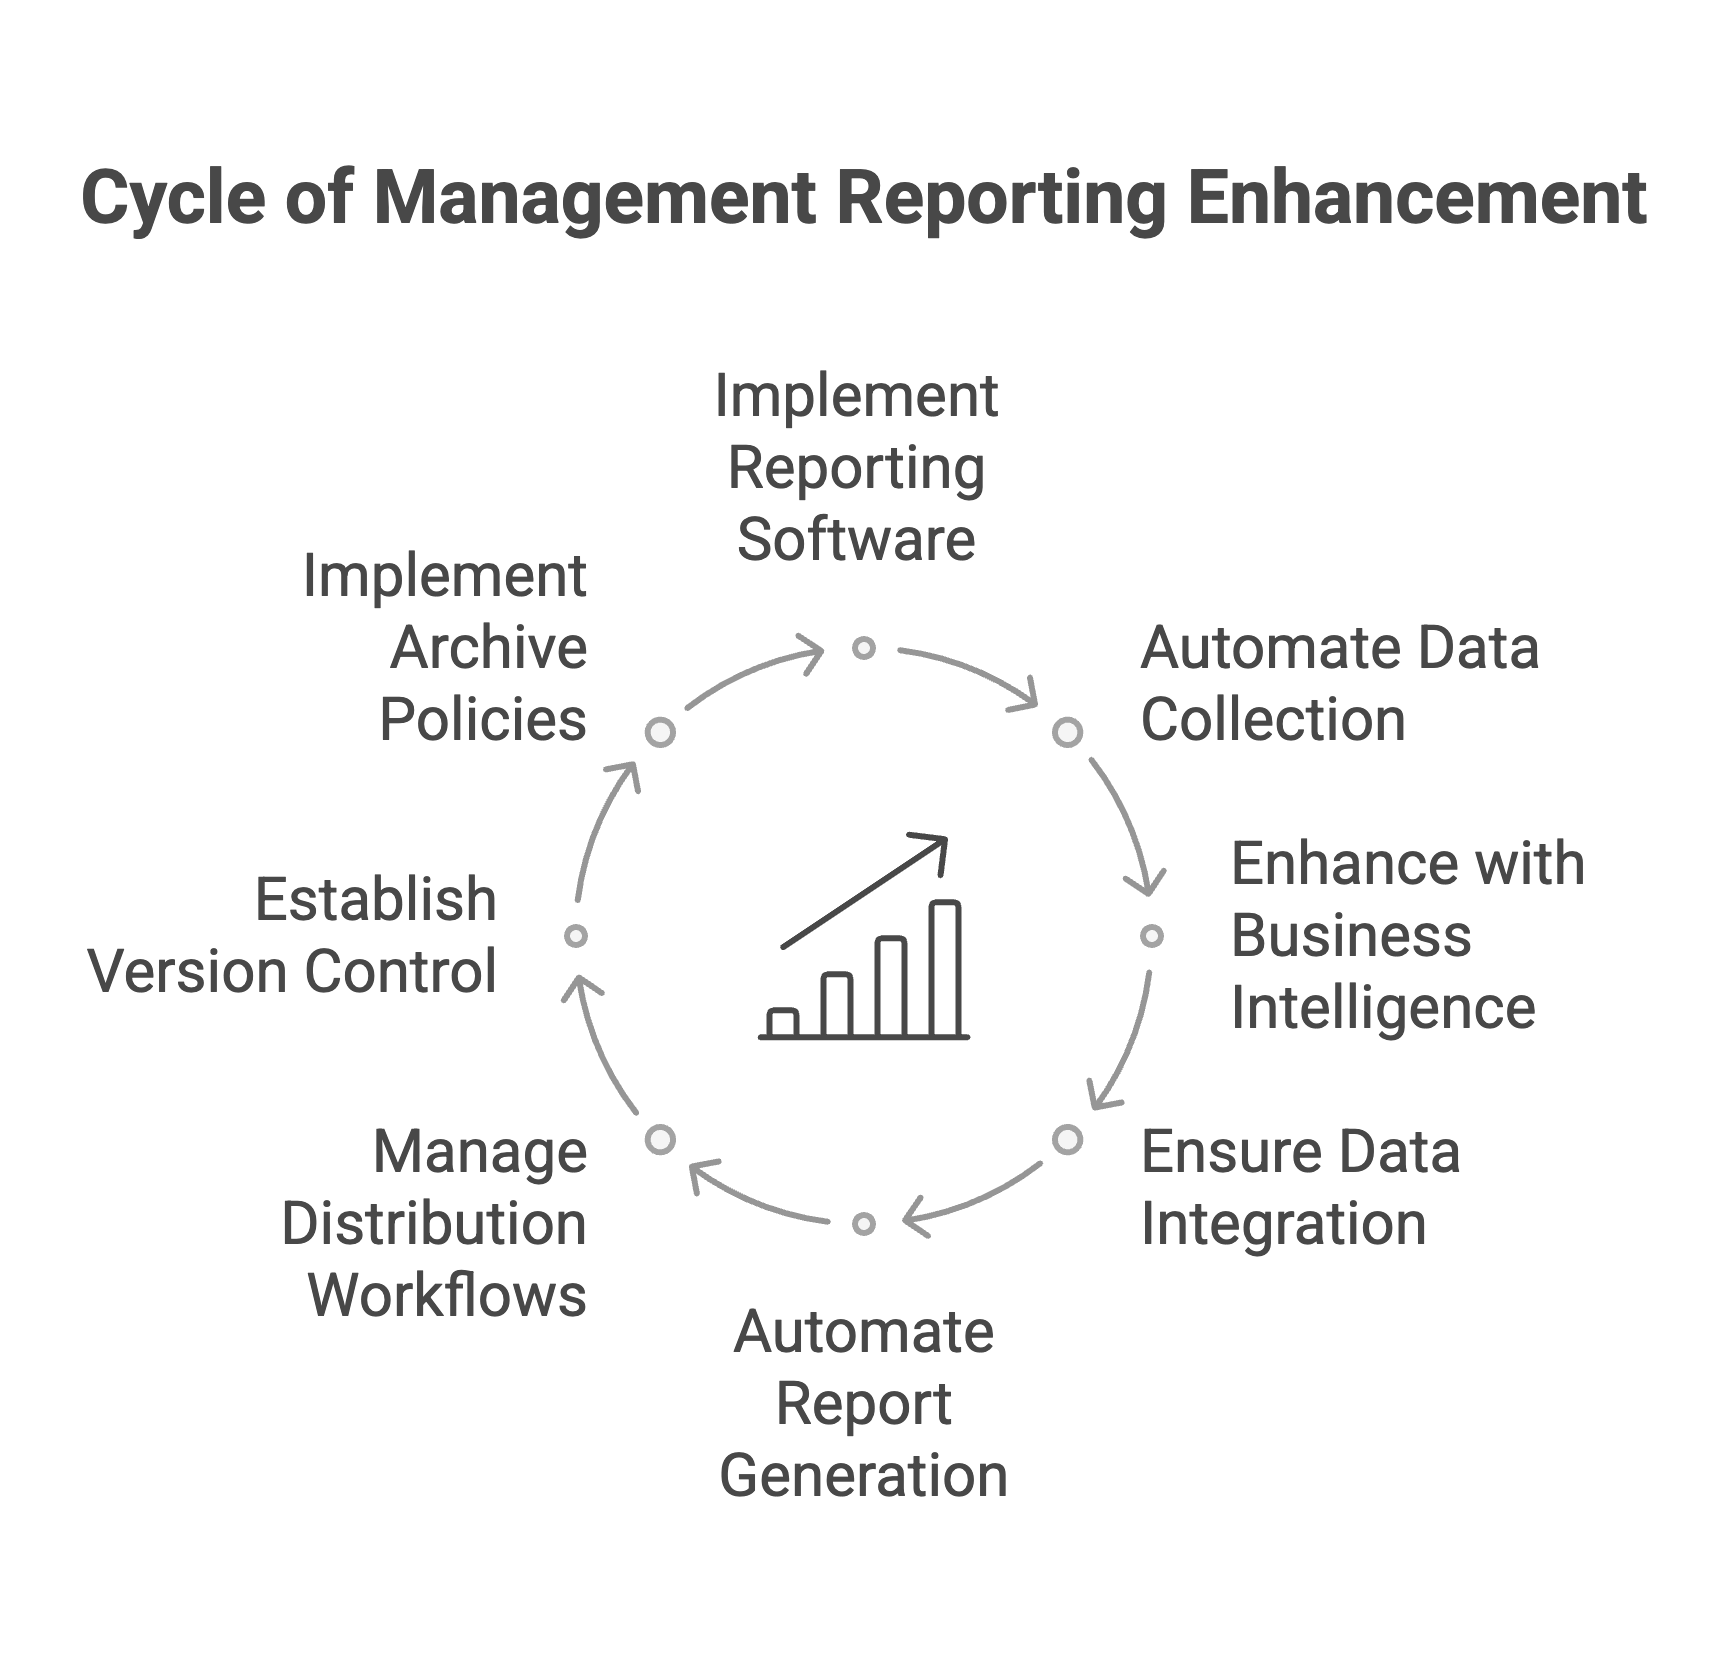
Modern reporting software can significantly improve the efficiency and effectiveness of management report packages. These tools automate data collection, standardize formatting, and enable more frequent reporting cycles.
Cloud-based reporting platforms offer advantages including real-time data access, collaborative features, and automatic distribution capabilities. These systems can integrate with various data sources to create comprehensive reporting packages.
Business intelligence tools provide advanced analytics and visualization capabilities that can enhance the insights available through management reporting. These platforms often include self-service capabilities that allow managers to explore data beyond standard reports.
Integration capabilities ensure that management reports reflect current operational and financial data without manual intervention. Look for solutions that can connect to your accounting system, CRM, and other business applications.
Automated report generation can ensure consistent quality while reducing the time required to produce management report packages. However, automation should enhance rather than replace human analysis and commentary.
Distribution workflows should ensure that reports reach the right people at the right time while maintaining appropriate security controls. Consider different distribution needs for different audience groups.
Version control becomes important when multiple people contribute to report packages or when reports are updated frequently. Establish clear procedures for managing revisions and ensuring everyone works with current information.
Archive and retention policies help maintain historical reporting records while managing storage requirements. Consider both regulatory requirements and business needs when establishing retention periods.
Q: What should be included in a standard management report package?
A: Essential components include an executive summary, key performance indicators, financial statements with variance analysis, operational metrics, and forward-looking commentary. The specific contents should be tailored to your audience's needs and decision-making requirements.
Q: How often should management report packages be distributed?
A: Most organizations produce monthly management report packages, though frequency can vary based on business needs. Some fast-moving businesses benefit from weekly updates, while others find quarterly comprehensive reports sufficient for their decision-making cycles.
Q: What's the ideal length for a management report package?
A: Effective management reports typically range from 10-25 pages, including executive summaries that can be read in 5 minutes or less. The key is providing comprehensive information while avoiding information overload that reduces readership.
Q: How can we improve management report readership and engagement? A: Focus on relevant insights rather than comprehensive data dumps, use clear visualizations, provide actionable commentary, and tailor content to specific audience needs. Regular feedback from report recipients helps identify improvement opportunities.
Q: Should management reports include forward-looking projections?
A: Yes, effective management reports combine historical performance with forward-looking analysis and projections. This helps management understand trends and anticipate future challenges or opportunities rather than just reviewing past performance.
Q: What technology tools are best for creating management report packages?
A: Options range from Excel-based solutions to sophisticated business intelligence platforms. The best choice depends on your data complexity, automation needs, and budget. Many organizations start with Excel and graduate to more advanced tools as needs grow.
Q: How do we ensure management reports remain relevant and useful?
A: Regular review and feedback sessions with report users help identify changing needs and improvement opportunities. Be prepared to adjust content, format, and focus as business priorities and management needs evolve over time.
Q: What common mistakes should be avoided in management reporting?
A: Common pitfalls include providing too much detail, lacking actionable insights, poor visual design, inconsistent formatting, missing context or commentary, and failing to tailor content to specific audience needs. Focus on clarity and relevance over comprehensiveness.
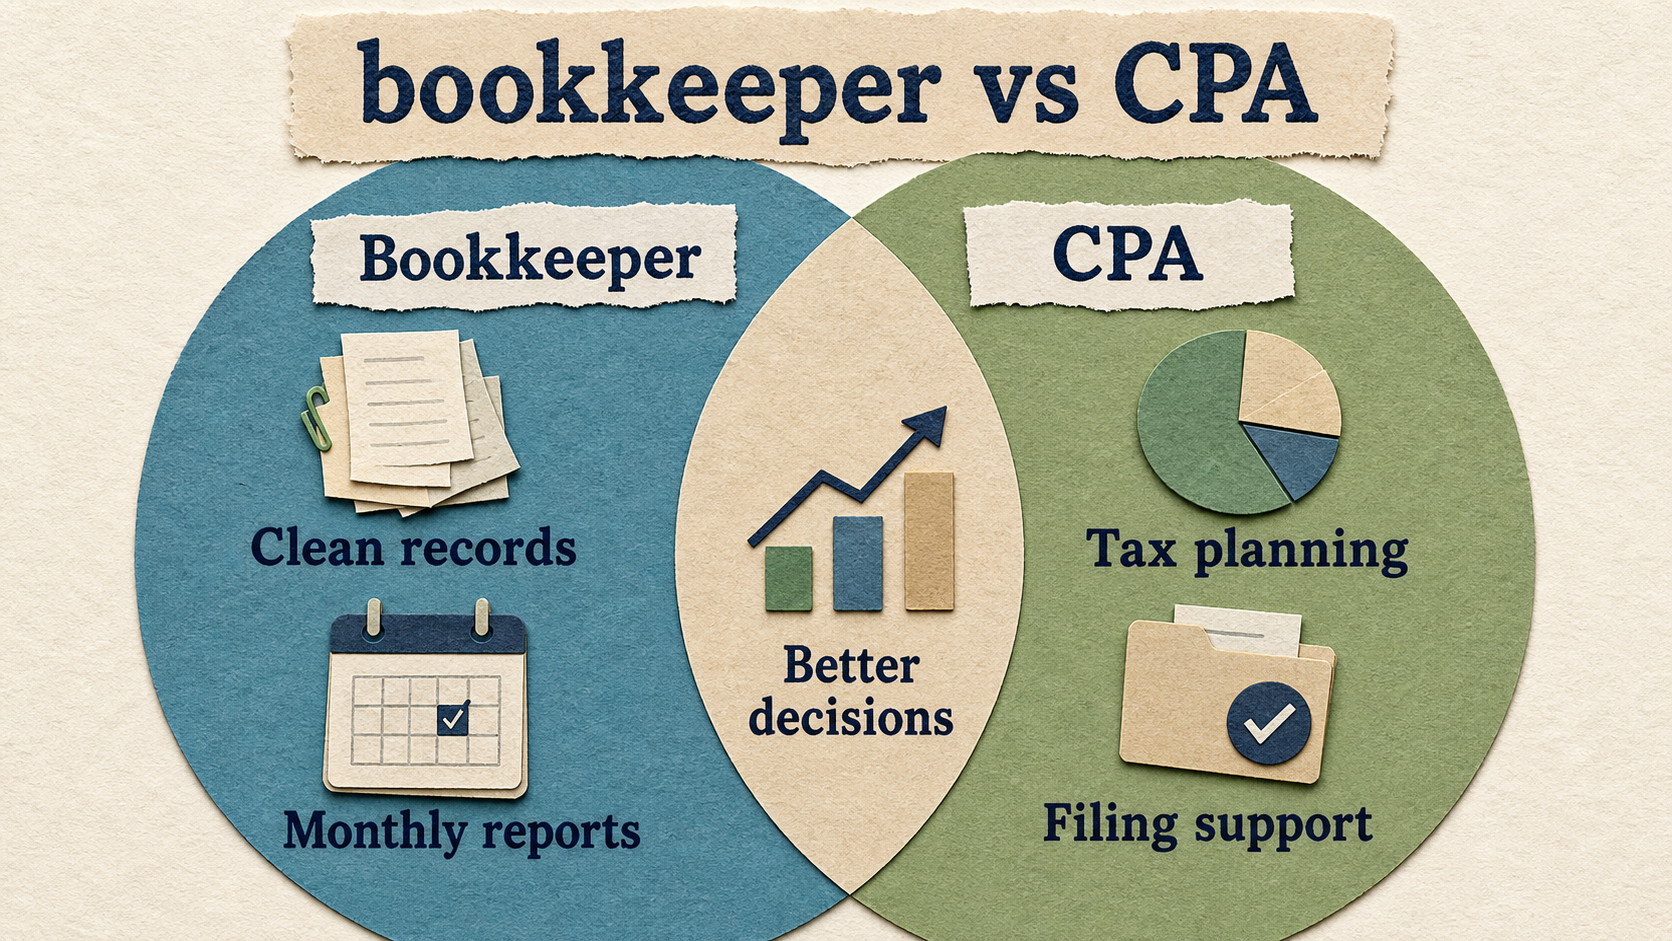
Compare a bookkeeper and CPA so your business knows when it needs recordkeeping, tax filing, planning, or higher-level advice.
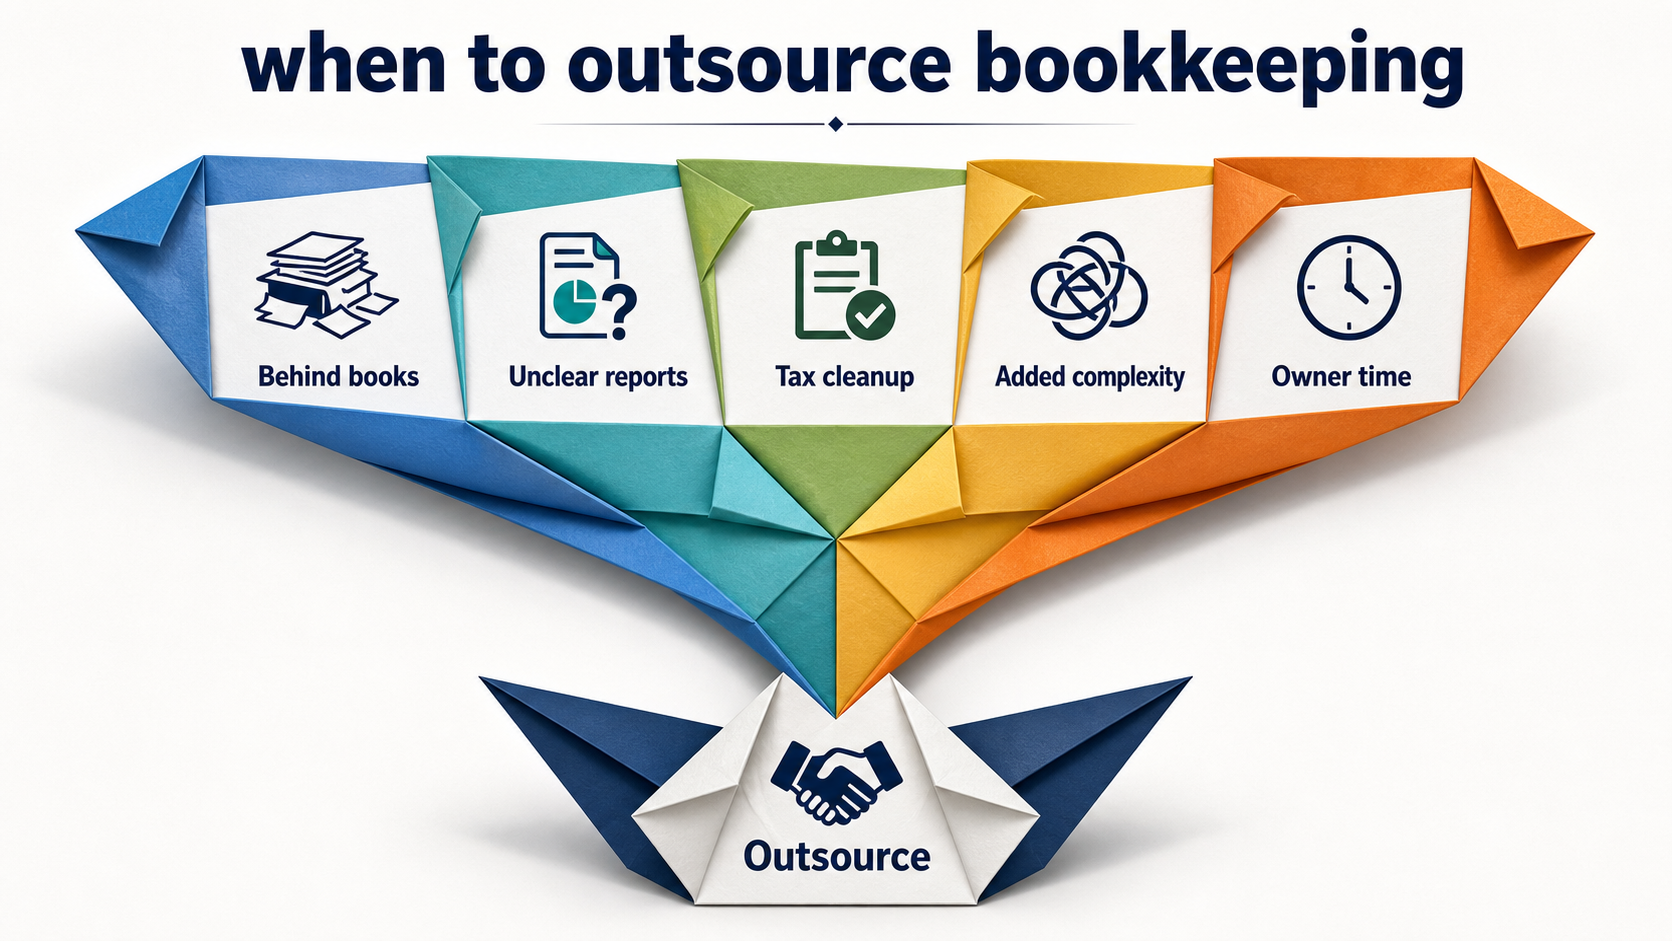
Learn when to outsource bookkeeping, what tasks to hand off first, and how outsourced bookkeeping supports tax planning and decisions.
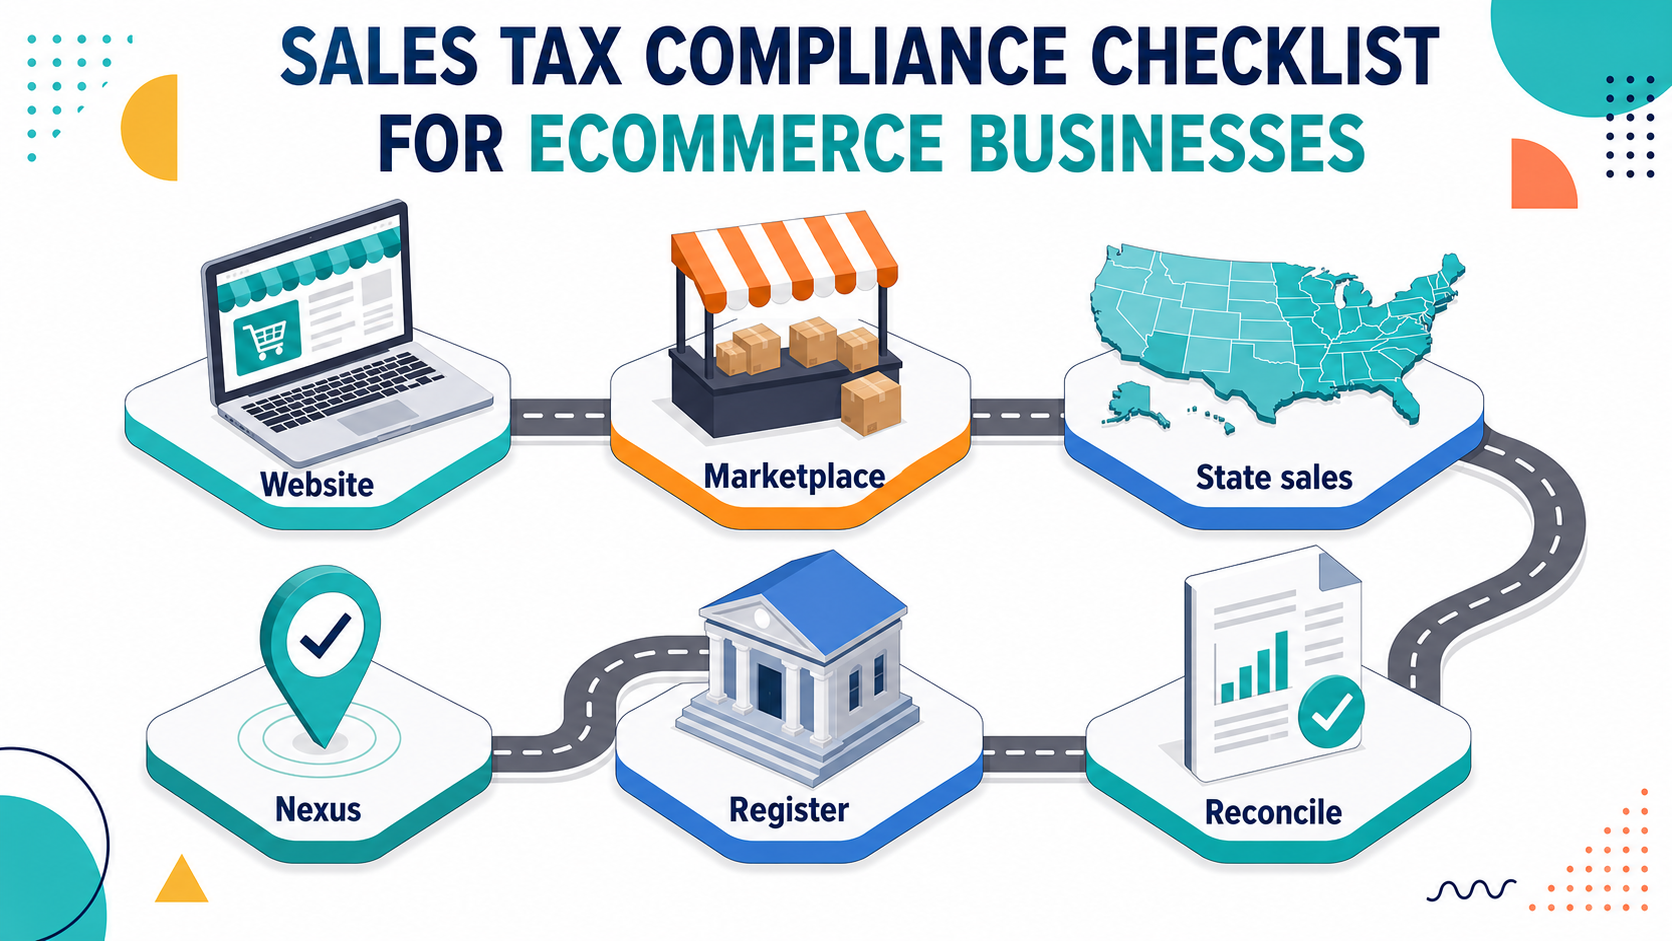
Use this ecommerce sales tax checklist to review nexus, registrations, marketplaces, product taxability, filings, and bookkeeping records.