
If you are deciding where to build your accounting team in 2025, the cost conversation usually starts with salaries and rates. It should not end there. A fair comparison looks at fully loaded onshore costs in the US or UK and compares them to all-in offshore vendor pricing for the same productive output. Below is a simple model you can lift into your business case, plus a quick way to pressure-test utilization and overtime.
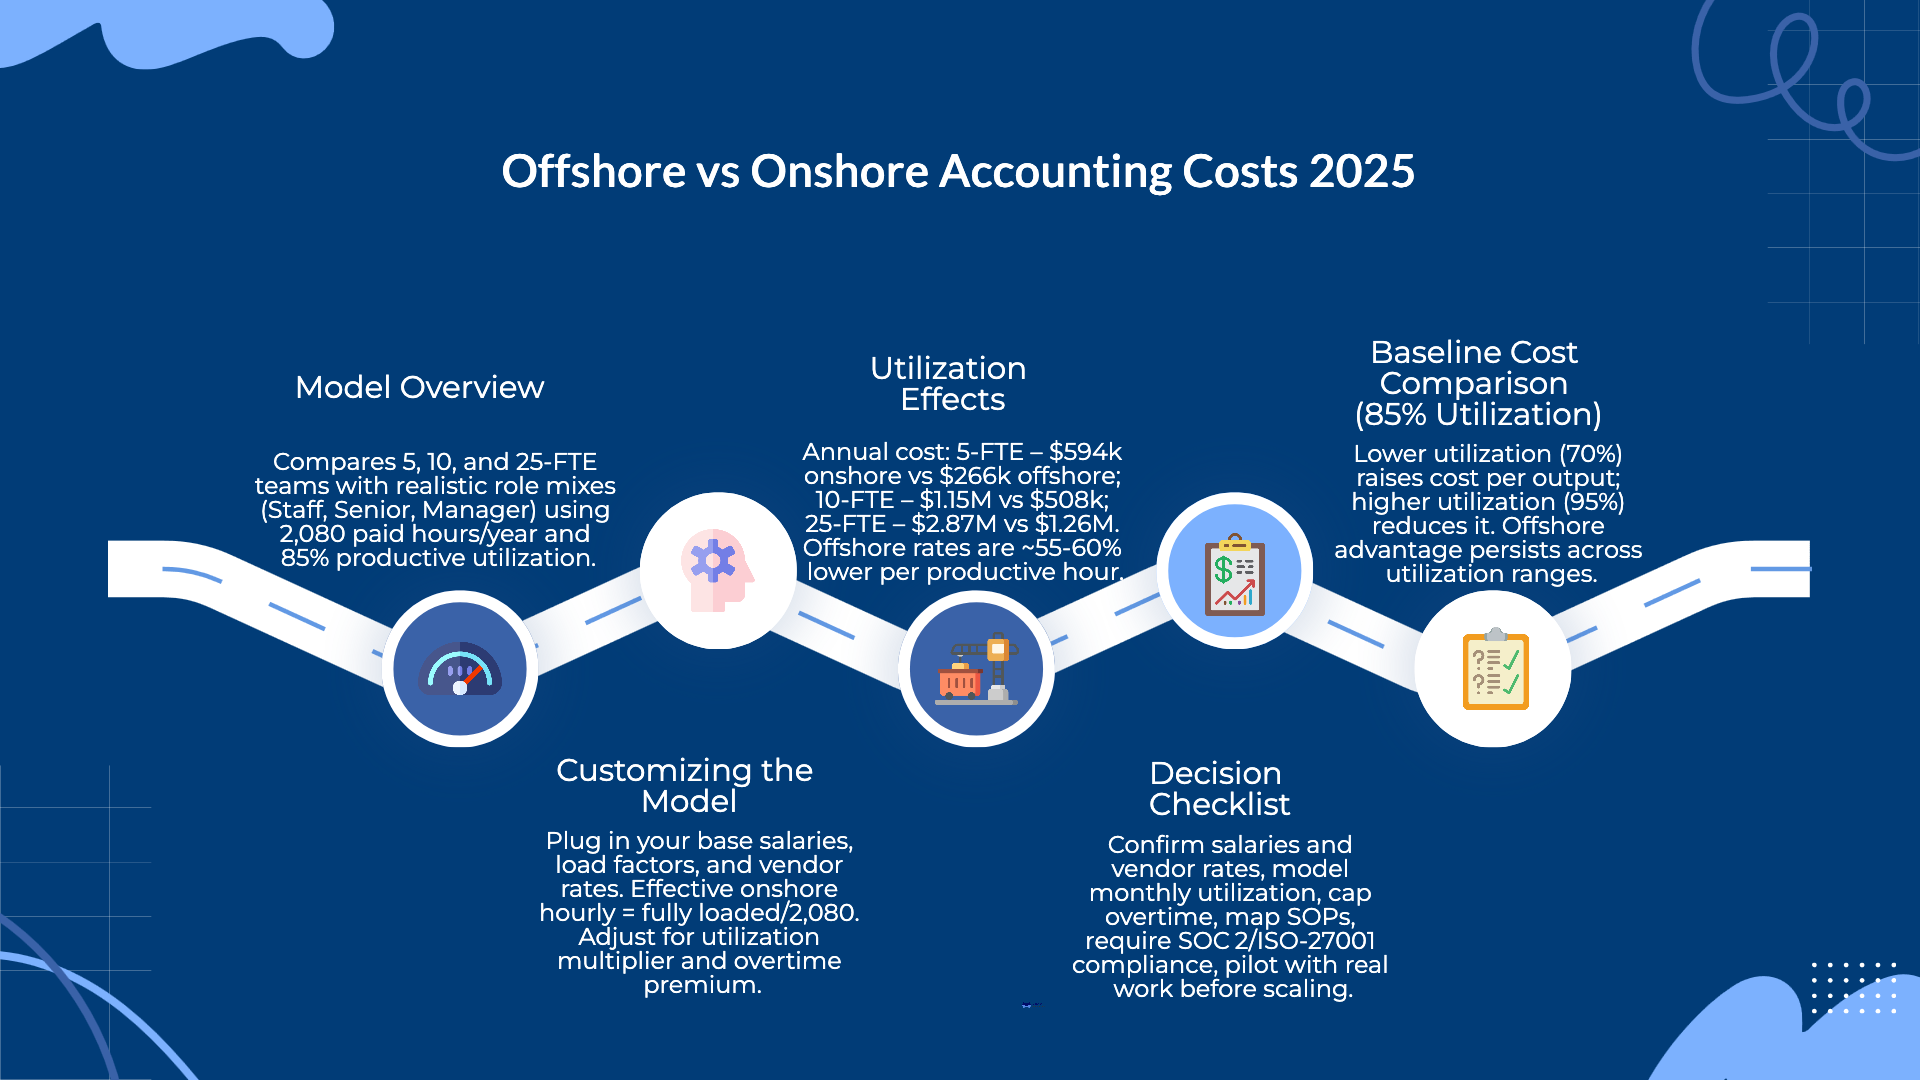
We compare three team sizes so you can see scale effects: 5, 10, and 25 FTE. Each team has a realistic role mix for day-to-day finance work.
For onshore teams, “fully loaded” means base salary plus employer taxes, benefits, facilities, software, and people-management time. For offshore teams, we use vendor hourly rates that already include wages, benefits, facilities, management overhead, and the vendor margin. We assume 2,080 paid hours per year and 85% productive utilization. That baseline is common for finance teams with meetings, close cycles, and PTO.
Here are the starting inputs you can replace with your numbers:
UK readers can swap in your regional salaries and employer on-costs. The structure stays the same.
Most CFOs want one view first. How much will I pay each year for a team that delivers a normal year of work, with no overtime?
Team sizeOnshore (US)Offshore5 FTE$594,000$266,24010 FTE$1,154,250$507,52025 FTE$2,868,750$1,256,320
Now turn that into something more useful. What is the blended cost per productive hour?
In plain terms, offshore comes in roughly 55 to 60 percent lower at steady state under these inputs.
Real life is never a flat 85 percent. New hires ramp. Month end runs hot. People take leave. Lower utilization means you pay more to deliver the same output. Higher utilization means the opposite. Here is the same workload priced at 70, 85, and 95 percent utilization.
If your program is young or spread across many part-time responsibilities, model 70 percent for the first two quarters. If your processes are stable and tracked by SOPs, target 90 to 95 percent. The relative advantage of offshore holds across the range.
Keep the formulas simple. Onshore fully loaded per role equals base salary times your load factor. The effective onshore hourly rate is fully loaded divided by 2,080. Offshore cost per role equals vendor hourly times 2,080. To scale for utilization, take the baseline utilization of 0.85 and divide it by your expected utilization to find the paid-hour multiplier. For overtime, multiply the effective hourly by overtime hours and the overtime premium, then add that to the annual cost.
A quick example helps. If your UK Senior Accountant costs 75k base and your on-cost load factor is 1.4, the fully loaded number is 105k. The effective hourly is about 50. If your offshore Senior rate is 26 per hour, the gap at the role level is about 48 percent before utilization effects.
Cost is not the only signal. If most of your work is judgment heavy, client facing, or requires real-time collaboration across time zones, an onshore or hybrid model may be safer. If 70 to 80 percent of the work is standardized and checked by clear reviews, offshore scales well. Many teams keep technical accounting, analytics, and stakeholder reporting onshore and move AP, AR, reconciliations, and close prep offshore with measured SLAs.
You do not need a long list here. You need a few non-negotiables that keep the numbers honest.
If you want a board-ready pack that reflects your salaries, FX, and seasonality, Madras Accountancy will build a tailored Offshore vs Onshore Accounting Costs in 2025: A Model for 5, 10, and 25-FTE Teams, run the sensitivity tables, and set up a small pilot so you can test cost and quality before you commit.

Single-entry vs double-entry bookkeeping made simple: how each accounting system works, the key differences, and which one your small business needs.
%2075-100%20(12).png)
CPA vs EA (enrolled agent) vs tax attorney: how each tax professional differs, who can represent you to the IRS, and which fits your tax needs.
%2075-100%20(9).png)
Learn how tax professionals should respond to a data breach, report theft to the IRS and states, notify clients, meet FTC rules, and prevent future attacks.