



The best profit margin improvement strategies start with arithmetic most owners skip. A business doing $2 million in sales at a 10% net margin keeps $200,000 before tax. Raise prices 3% with no loss of volume and that same business keeps $260,000, a 12.6% net margin, because every dollar of the increase drops straight to profit. Grow sales volume 3% instead and profit rises only to about $224,000, since the extra units carry their own cost of goods.
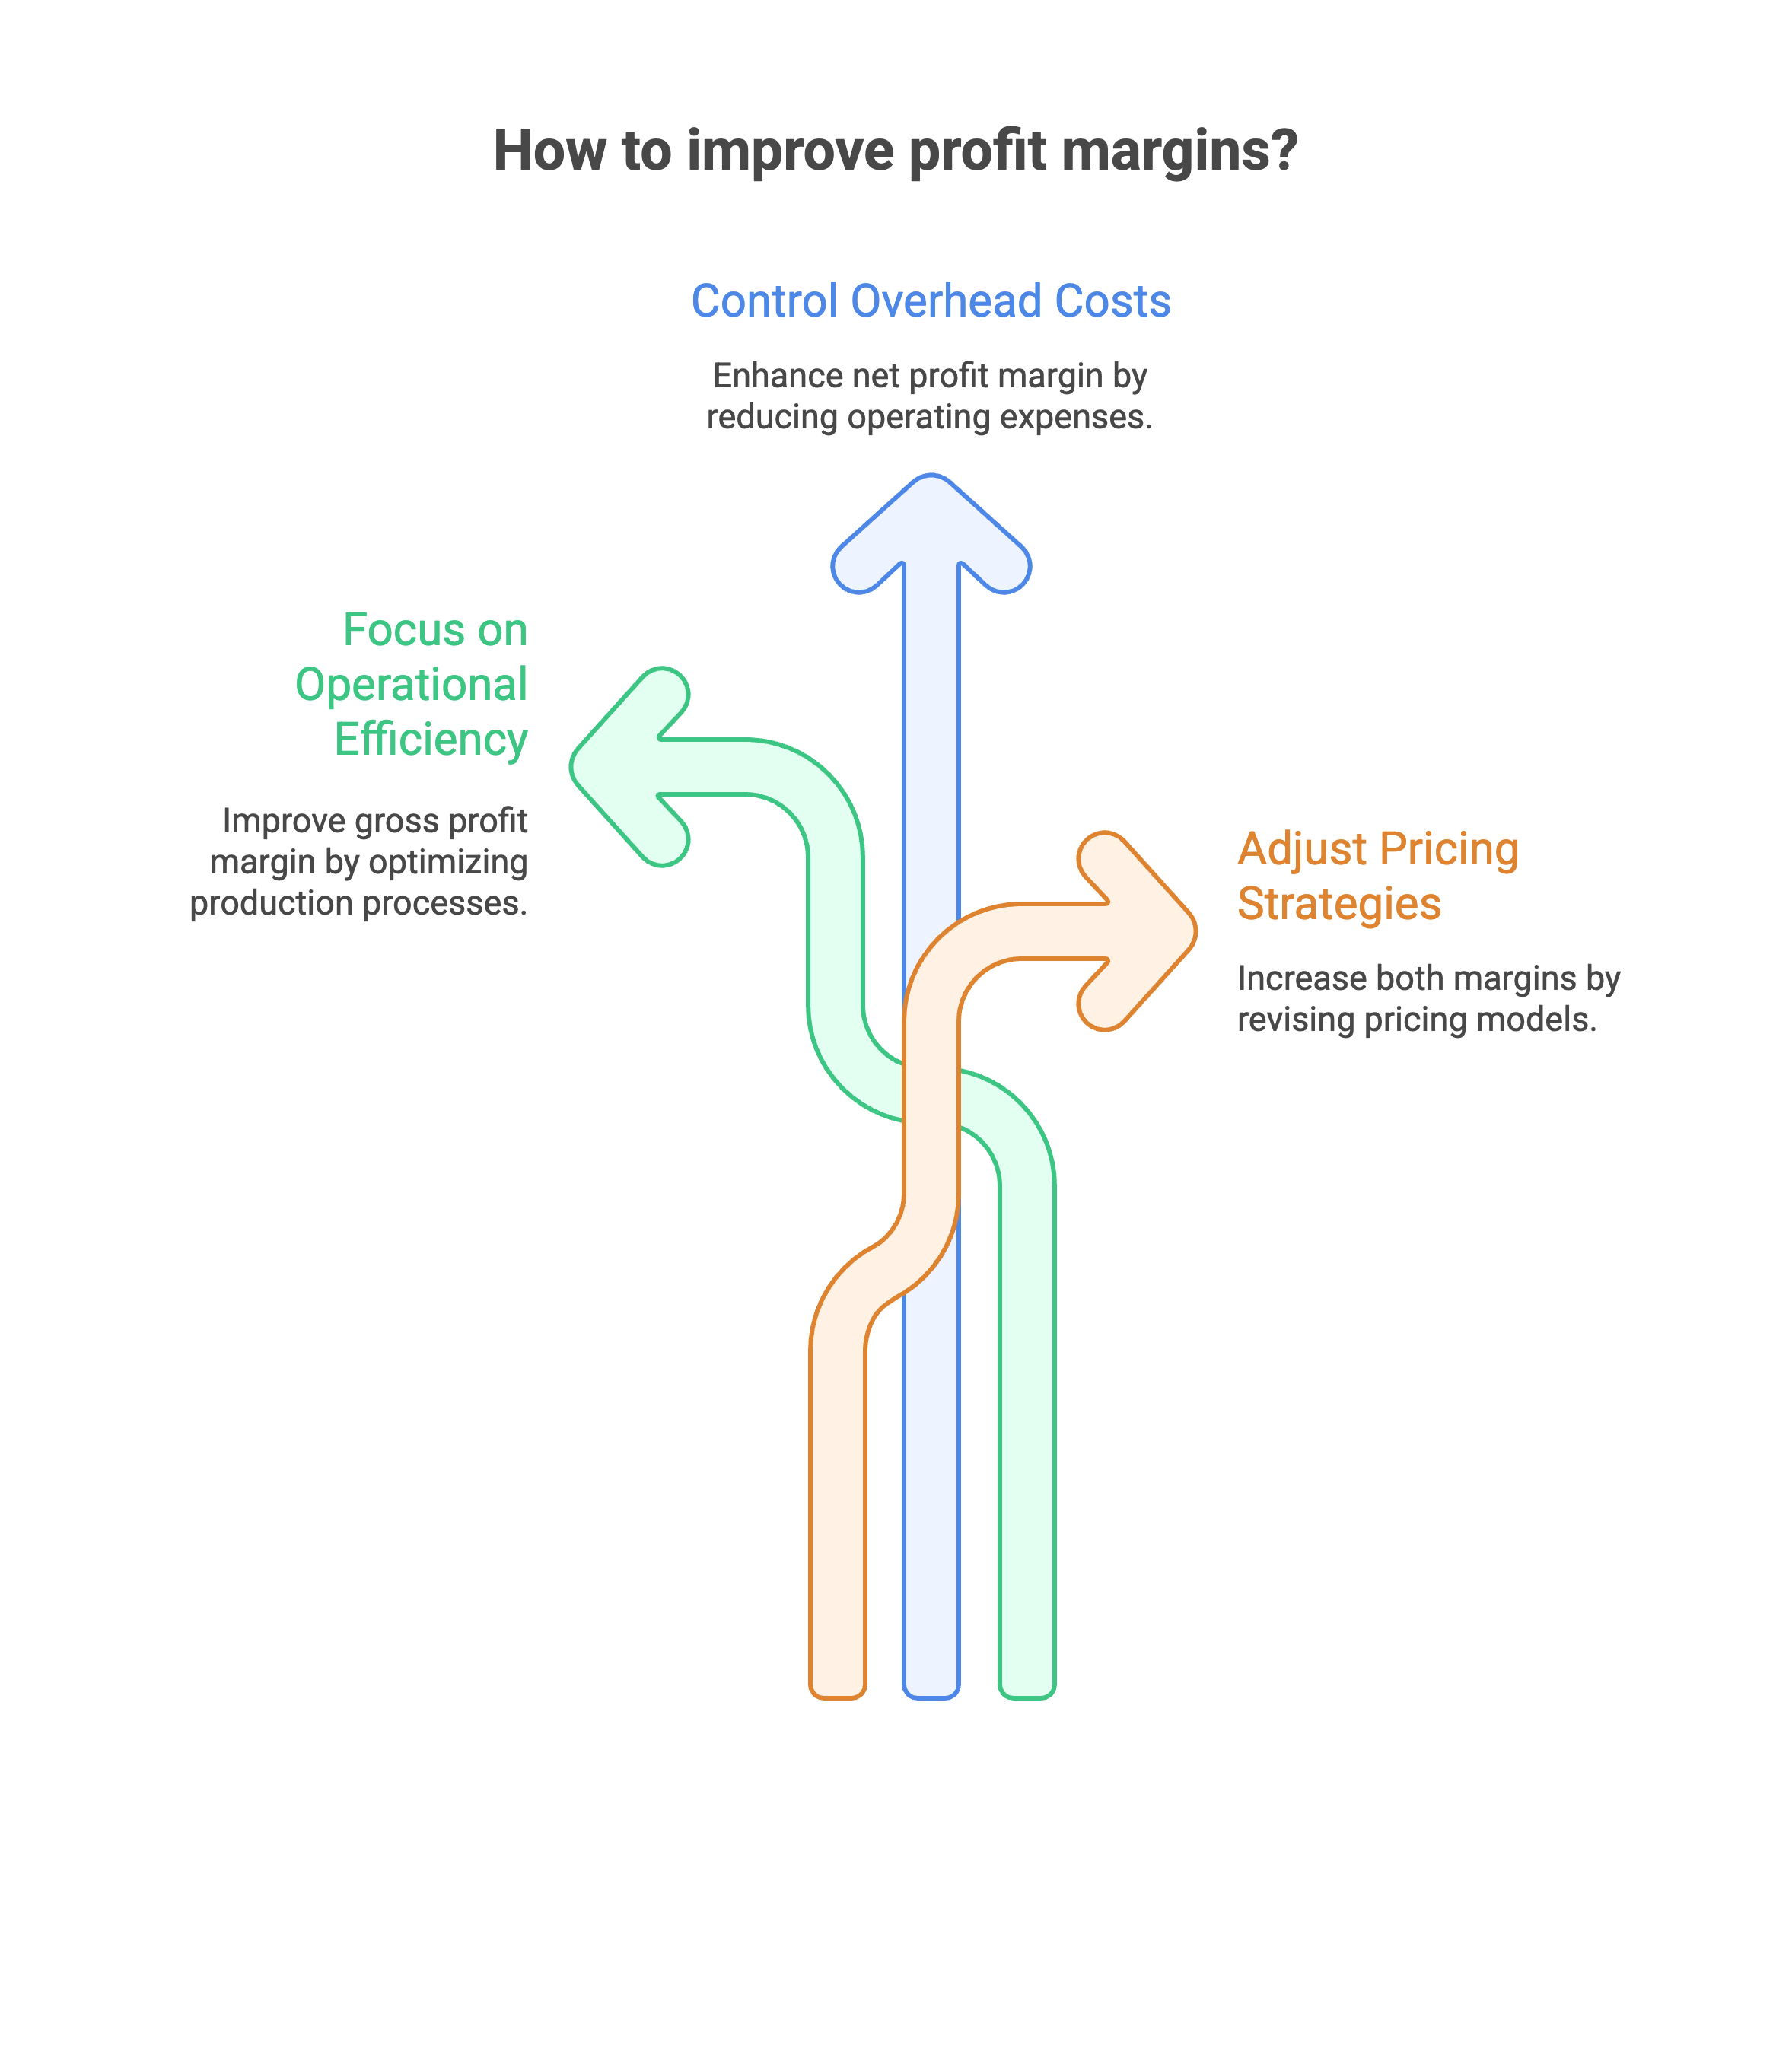
That gap explains why margin work usually beats chasing revenue. The nine moves below are the ones we see produce measurable results in the books of small and mid-sized US businesses, in roughly the order a CPA would test them.
Three margins matter, and each points at a different problem.
A healthy gross margin with a thin net margin means overhead is the issue. A weak gross margin means pricing or direct costs are wrong, and no amount of overhead trimming will fix it. Corporations and partnerships report cost of goods sold to the IRS on Form 1125-A, so the COGS figure on your tax return should reconcile to the one you use for management decisions. If it doesn't, start there. Our walkthrough of reporting COGS on Form 1125-A covers what belongs in that number.
Watch the difference between margin and markup. A product that costs $60 and sells for $100 has a 40% margin but a 66.7% markup on cost. Owners who price with a "40% markup" often believe they are earning a 40% margin when the real figure is 28.6%.
Take the same business: $2,000,000 in revenue, $1,200,000 cost of goods sold (a 40% gross margin), $600,000 of overhead and $200,000 of pre-tax profit. Here is what each lever does when pulled on its own, assuming overhead stays fixed unless stated.
| Scenario | Revenue | COGS | Overhead | Pre-tax profit | Margin |
|---|---|---|---|---|---|
| Starting point | $2,000,000 | $1,200,000 | $600,000 | $200,000 | 10.0% |
| Prices up 3%, same volume | $2,060,000 | $1,200,000 | $600,000 | $260,000 | 12.6% |
| Prices up 3%, volume down 5% | $1,957,000 | $1,140,000 | $600,000 | $217,000 | 11.1% |
| Volume up 3% at same prices | $2,060,000 | $1,236,000 | $600,000 | $224,000 | 10.9% |
| COGS down 2% | $2,000,000 | $1,176,000 | $600,000 | $224,000 | 11.2% |
| Overhead down 5% | $2,000,000 | $1,200,000 | $570,000 | $230,000 | 11.5% |
Two things stand out. Even after losing 5% of its volume, the price increase still beats 3% volume growth. And a 5% overhead cut ($30,000) is worth more than a 2% COGS cut ($24,000) here, even though the overhead base is half the size. Run the same table with your own numbers before deciding where to spend effort.
Margins only mean something against your own industry. The table below uses NYU Stern professor Aswath Damodaran's margin dataset for US sectors, based on data as of January 2026. These are publicly traded companies, so a small private business will often run below them, but the spread between sectors is instructive.
| Sector (US public companies) | Gross margin | Net margin |
|---|---|---|
| Software (system and application) | 71.72% | 25.49% |
| Restaurant/dining | 32.24% | 9.37% |
| Retail (general) | 33.18% | 5.61% |
| Retail (grocery and food) | 26.31% | 1.32% |
| Engineering/construction | 15.46% | 5.94% |
| Machinery | 37.47% | 10.58% |
| Total market | 37.76% | 9.74% |
A grocer at 1.3% net and a software company at 25% net need very different playbooks. The grocer's lever is shrink, labor scheduling and vendor terms. The software company's lever is pricing and churn. Restaurant owners can compare against our breakdown of average restaurant revenue and profit margin.
Pricing is the fastest lever because it has no matching cost. Before raising prices, work out how much volume you could lose and still be no worse off. The formula is: price increase ÷ (contribution margin + price increase).
Using the $2 million example with a 40% gross margin, a 3% price increase gives 0.03 ÷ (0.40 + 0.03) = 7.0%. You could lose almost 7% of unit volume and still earn the same gross profit. Most businesses that raise prices modestly lose far less than that, though you should track it rather than assume it.
Practical steps:
Our break-even analysis guide shows how to run the same math for new products and price points.
On a $1.2 million COGS base, a 2% reduction saves $24,000, lifting the net margin in our example from 10% to 11.2%. Typical sources:
Most businesses have a long tail of products that consume time, inventory and attention without earning their keep. Build a simple report that shows revenue, direct cost and gross margin for every product or service line for the last 12 months. Then rank it.
In many businesses a small group of products produces most of the gross profit, while the bottom of the list earns little or loses money once handling and returns are included. Options for the bottom group include repricing, bundling, moving to made-to-order or discontinuing. Our article on how better cost accounting improves margins explains activity-based costing for businesses that need more precision than a flat overhead rate. Online sellers should also read our breakdown of e-commerce profitability after fees and shipping, since platform fees can swallow a product's margin.
Customers differ in cost to serve as much as products do. A client who pays on time, orders in full cases and rarely calls support is worth more than a larger client who demands rush orders, custom terms and 90-day payment.
For each major customer, total the revenue, direct costs, discounts, returns, support hours and days to pay. Customers who fall below your target margin get one of three responses: a price change, a service-level change (minimum orders, standard terms) or a polite exit. Professional service firms can apply the same approach by client and engagement.
Overhead tends to grow quietly. Set a target for operating expenses as a percentage of revenue and review the actual figure monthly. Where it rises, the usual causes are:
Labor is often the biggest overhead line. Rather than cutting headcount, look at which tasks senior staff do that could be automated or handled at a lower cost. Monthly variance analysis against budget catches overhead creep within weeks rather than at year-end.
Revenue from existing customers usually costs less to win than revenue from new ones, so it tends to carry a higher margin once marketing and sales costs are counted. Two tactics produce results:
Measure the margin on upsell revenue separately. An upsell program that relies on deep discounts can raise revenue while lowering margin.
Cash tied up in receivables and inventory costs money, either as interest on a credit line or as growth you can't fund. Interest expense sits below operating income, so reducing borrowing directly improves net margin.
Shorten payment terms for new customers, invoice the day work is delivered and offer card or ACH payment. On the inventory side, reorder points based on actual sales velocity reduce both carrying cost and markdowns. Our guide to working capital management covers the cash conversion cycle in detail.
Margin improvement fails when nobody watches the results. A monthly dashboard should show gross margin by product line, operating expenses as a share of revenue, average selling price, discount rate, days sales outstanding and inventory turns. Our list of essential KPIs for small business financial performance explains how to calculate each one, and our guide to financial ratio analysis for small business owners shows how to read them together.
All of this depends on books that close on time with accurate cost coding. If revenue and COGS land in the wrong month, gross margin swings around and decisions get made on noise.
Many owners know their margin is too thin but don't have the time to run the analysis. A part-time or outsourced CFO can build the product and customer profitability reports, run pricing scenarios and hold the monthly review meeting. Our article on CFO services for small businesses explains what that engagement looks like and when it pays for itself.
Sequence matters. Fix the data first, because pricing and cost decisions made on inaccurate COGS can make things worse. A sensible order for most businesses:
Price changes show up in the next month's results. Supplier and process changes typically take a quarter or two to appear in full.
What is a good profit margin for a small business? It depends heavily on industry. Using the January 2026 Damodaran data, US public companies across all sectors averaged a net margin of about 9.7%, while grocery retail ran near 1.3% and system software above 25%. Compare yourself against your own sector and against your own trend over the last three years.
What is the difference between profit margin and markup? Margin is profit divided by the selling price. Markup is profit divided by cost. A $40 profit on a $100 sale is a 40% margin and a 66.7% markup, so confusing the two leads to underpricing.
Is it better to raise prices or cut costs to improve margins? Test both, but pricing usually acts faster because it carries no offsetting cost. Cost reductions are slower to implement and can damage quality if done carelessly. Most businesses get the best result from a modest price increase paired with a supplier rebid.
How often should I review my profit margins? Review gross and operating margin every month once the books are closed, and product and customer profitability every quarter. Revisit pricing at least once a year, or sooner when input costs move sharply.
Can bookkeeping errors distort profit margins? Yes. Misclassifying direct costs as overhead inflates gross margin, and recording inventory purchases as expenses instead of through COGS distorts both. Clean monthly reconciliations are the precondition for every strategy above.
Madras Accountancy prepares monthly closes, product and customer profitability reports and CFO-level margin reviews for US businesses and CPA firms. If you want a clear picture of where your margin is leaking, talk to our team.

The section 4960 excise tax is 21% of nonprofit pay over $1M. From 2026 it covers all employees. See the medical carve-outs, Form 4720 and a worked example.

The paid family and medical leave tax credit is permanent from 2026. See the 12.5% to 25% rates, the premium option, the 6-month rule and how Form 8994 works.

Opportunity zones become permanent in 2027 under the One Big Beautiful Bill. See the new deferral, rural bonus, and the 2026 handoff.