


A rolling forecast keeps a fixed window of future months in view, usually 12, and adds a new month each time one closes. This rolling forecast implementation guide covers the full process: choosing the horizon and update cadence, building a driver-based model, running the monthly roll, and putting governance and tools around it so the numbers stay trusted.
Most small and mid-sized companies can run a 12-month rolling forecast with a monthly close, a short list of business drivers and a spreadsheet or planning tool. The implementation work sits mostly in process design: who owns each driver, when the roll happens after close, and how changes get approved. The sections below follow the order in which a finance team would build it.
A static budget is set once and held for the year. The OpenStax managerial accounting text describes it as a budget "which remains at one amount regardless of the production level" and notes that "the static budget is created before the fiscal year begins" (OpenStax, Principles of Managerial Accounting, 7.1).
The same text defines a rolling budget as "one that is continuously updated" where "a new month is added as each month passes." It also flags the cost: rolling budgets take "management away from other duties as it requires continual updating." That trade-off shapes every design choice in this guide. If you are setting up a first annual plan, start with a step-by-step business budget and add the rolling layer once the monthly close is reliable.
| Feature | Static annual budget | 12-month rolling forecast |
|---|---|---|
| Time window | Fixed fiscal year that shrinks as months pass | Always 12 months ahead |
| When built | Before the fiscal year starts | Updated after each month or quarter closes |
| Level of detail | Often every general ledger line | Key drivers plus summary lines |
| Main use | Targets, approvals, performance evaluation | Resource decisions, cash planning, hiring timing |
| Effort profile | One long annual cycle | Smaller, repeated monthly or quarterly cycles |
Research suggests the two tools usually coexist. A case study of three industrial firms in the Journal of Management Control found that in some firms "rolling forecasting supported the supremacy of annual budgeting," while in others ideas from forecast discussions were often acted on "before quantified monetary deviations between plans and targets emerged" (Henttu-Aho, 2018). A study of Spanish companies reached a similar view: rolling forecasts worked as a planning tool, but "they cannot replace budget for evaluation and motivation purposes" (Lorain, 2010, Emerald). In that study, "more than 60% of the respondents consider that changes in the environment makes it very difficult to establish accurate budgets," though the author cautions that "the findings rely on a small number of survey respondents and interviewed organizations."
For most owner-managed businesses, a hybrid works: keep the annual budget for targets and bonus plans, and use the rolling forecast for decisions.
The horizon is how far ahead the forecast looks. The cadence is how often you roll it. In practice, rolling forecasts commonly look 12 to 18 months ahead and are updated monthly or quarterly.
The Association for Financial Professionals (AFP) frames the horizon choice as a trade-off: "The further out into the future, the more insightful the forecast may be, but the less accurate." It adds that "there is no rule of thumb; a company should determine what is most appropriate for its circumstances" (AFP, 8 Steps for Creating a Rolling Forecast).
The following guidance reflects common practice and should be adapted to your business:
Match the cadence to your close. As a rule of thumb, a monthly roll works best when the books close within about two weeks; otherwise the forecast is built on stale actuals. A documented routine such as a five-day close checklist with AP, AR and reconciliation SOPs is the foundation for a monthly cadence.
A driver-based model forecasts a small number of operational inputs and lets formulas produce the financial statements. AFP's FP&A guide puts it plainly: "Driver-based modeling links business drivers to financial outcomes," and "the key drivers of the model should have quantifiably strong predictive ability, measured on or derived from data" (AFP FP&A Guide to Driver-based Models and Plans).
AFP also warns that "the more steps and calculations to create a driver, the more the opportunity for error or false readings." In practice, that argues for a short driver list. Typical drivers by business model:
The AFP article recommends that leaders "assess what dimensions of the business are most important to its success rather than focus on every line item in the chart of accounts." Lines that do not move with a driver, such as insurance, can sit as flat monthly amounts. Pick drivers you already measure, and link them to the KPIs your business tracks for financial performance so the forecast and the management report speak the same language.
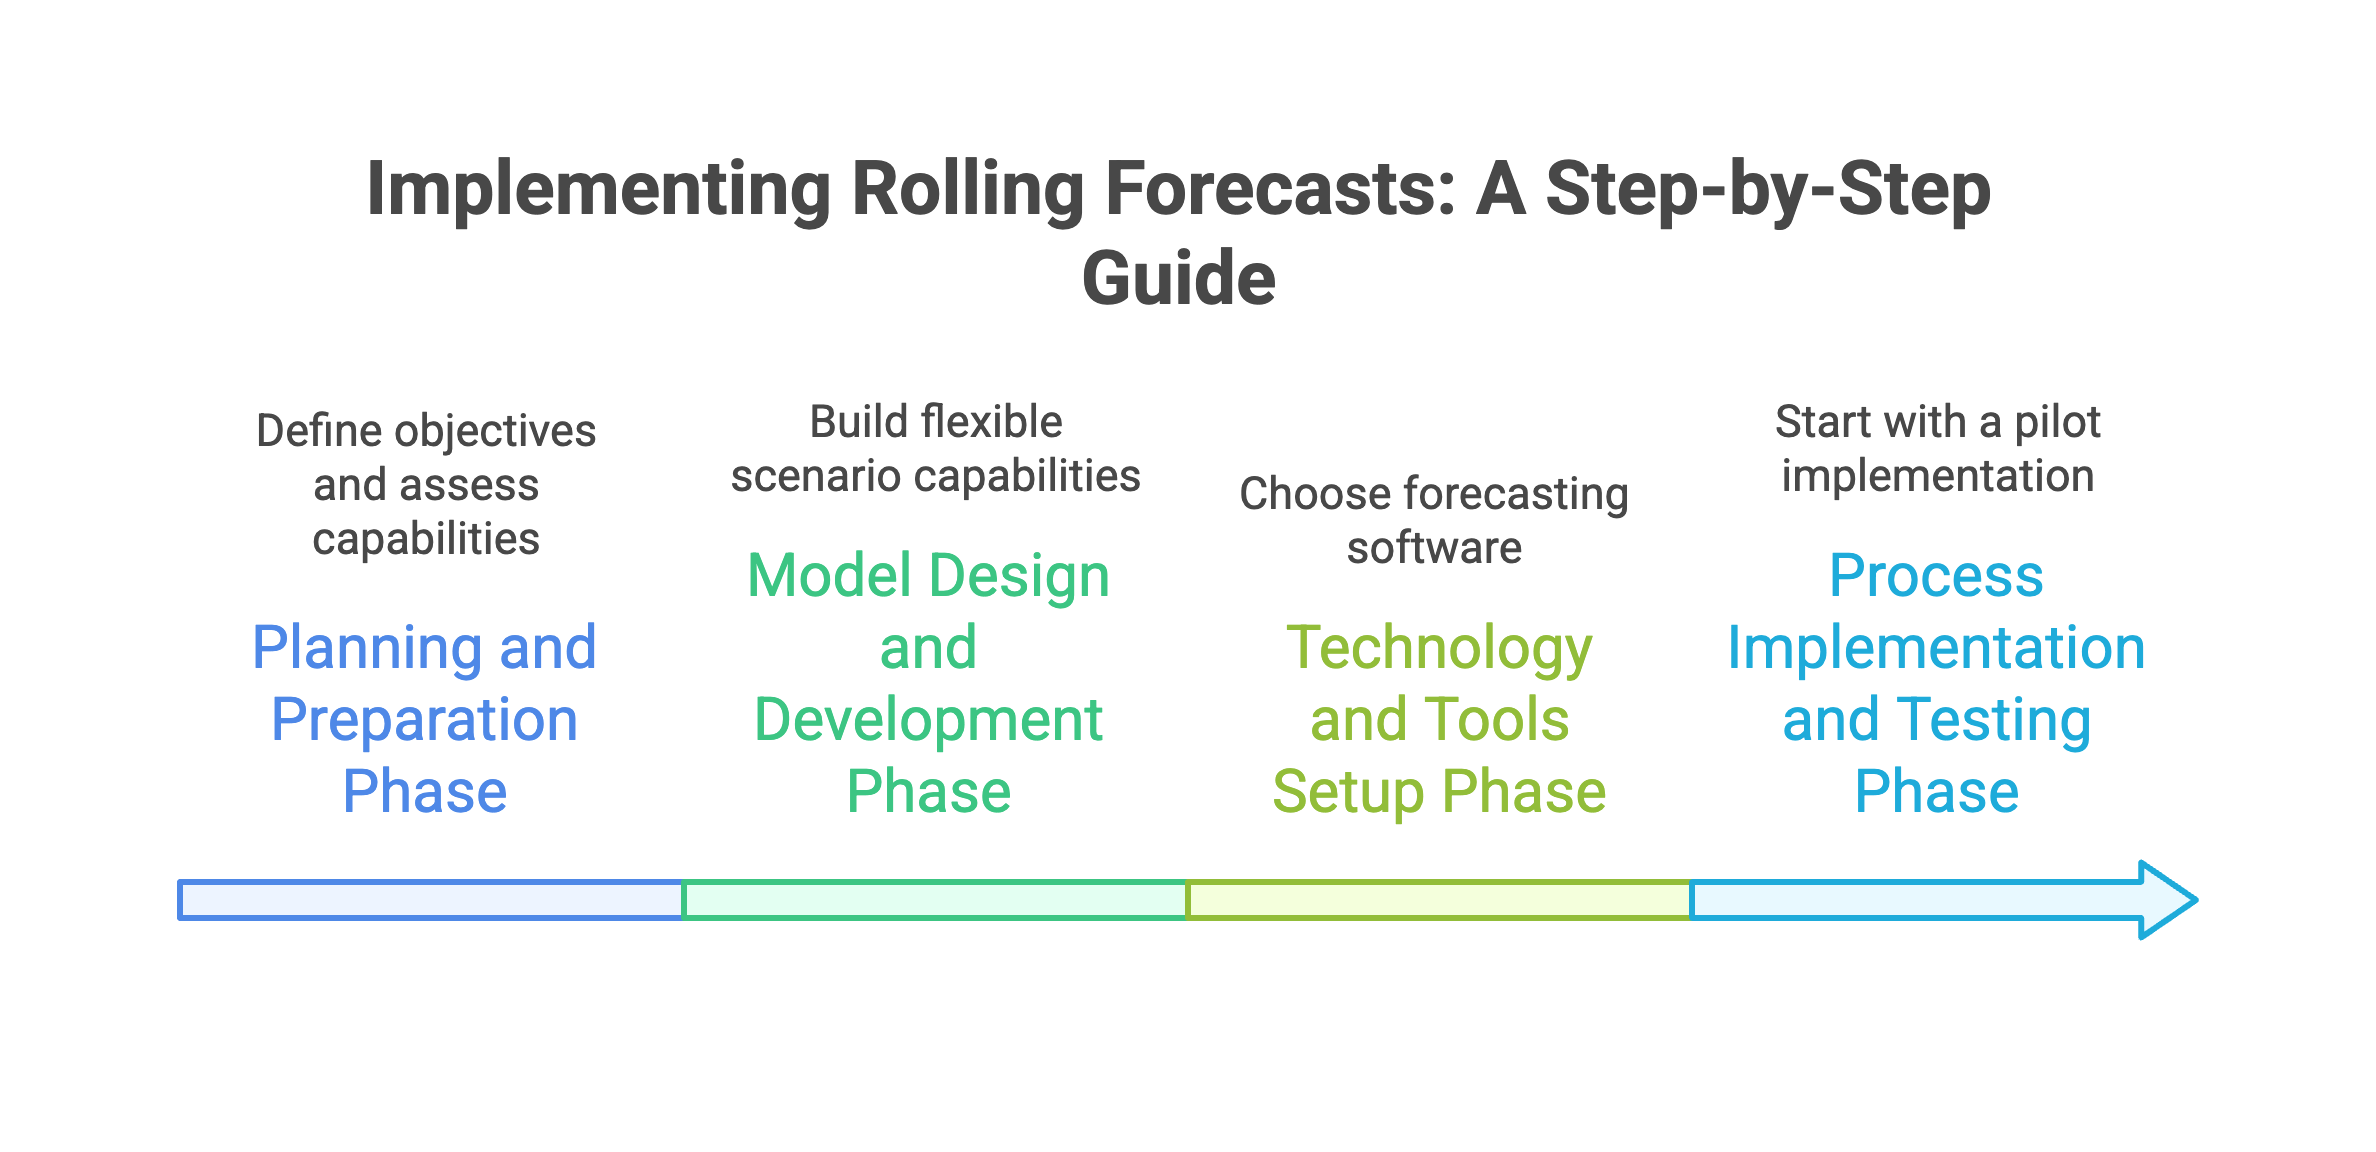
Phase 1: Planning and preparation. Write down which decisions the forecast will support, such as hiring timing, debt covenants or inventory buys. AFP's first step is to "identify the end goal." Then set the horizon, cadence and the owner of each driver.
Phase 2: Model design. Build the driver tab, the monthly P&L, and a simple cash and balance sheet bridge. Keep assumptions on one sheet, separate from formulas. Add a scenario switch so you can run base, downside and upside cases. AFP notes that "using scenarios, or 'what-if' analyses, FP&A teams can develop a range of possible financial outcomes given a set of assumptions and key drivers." For deeper downside testing, see our guide to cash flow scenario planning techniques.
Phase 3: Data and tools. Map where each actual comes from: the general ledger, CRM, payroll and billing system. AFP's sixth step is to "ascertain the quality of data sources and that the information feeding into the rolling forecast is correct." Automate the actuals import where the tool allows it.
Phase 4: Pilot and test. Run two or three rolls in parallel with the existing budget before anyone relies on the forecast. Back-test it by forecasting a past period from older data and comparing the result with what happened.
As practical guidance, a small company with clean books can usually complete phases 1 to 3 within one quarter and use the pilot rolls in the next.
The following example is illustrative. A subscription business closes March 2026 and builds a 12-month forecast for April 2026 to March 2027. Its drivers:
That window forecasts $1,395,000 of revenue and $94,500 of operating income.
April closes. Actual April customers are 404 (4 net adds instead of 10), and a price change lifts revenue per customer to $260. April revenue is 404 × $260 = $105,040, which is $2,540 above the $102,500 forecast. The higher price masked weaker customer growth.
The team rolls the forecast. April 2026 drops out and April 2027 is added, so the new window is May 2026 to April 2027. Driver owners agree three updates: net adds of 6 a month, revenue per customer of $260, and moving the two hires from July to September 2026.
| Quarter in window | Original window (Apr 26 to Mar 27) revenue | Original operating income | Rolled window (May 26 to Apr 27) revenue | Rolled operating income |
|---|---|---|---|---|
| Months 1 to 3 | $315,000 | $40,500 | $324,480 | $47,136 |
| Months 4 to 6 | $337,500 | $2,250 | $338,520 | $20,964 |
| Months 7 to 9 | $360,000 | $18,000 | $352,560 | $12,792 |
| Months 10 to 12 | $382,500 | $33,750 | $366,600 | $22,620 |
| Full 12 months | $1,395,000 | $94,500 | $1,382,160 | $103,512 |
The useful comparison is the 11 months both windows share, May 2026 to March 2027. Revenue in those months falls from $1,292,500 to $1,258,400, a drop of $34,100. With cost of revenue at 30%, gross profit falls by $23,870. Delaying two hires by two months saves 2 × 2 × $9,000 = $36,000. Operating income for the shared months rises from $82,750 to $94,880, an increase of $12,130 ($36,000 less $23,870).
The end-point customer count tells the bigger story. The original forecast expected 520 customers by March 2027; the rolled forecast expects 470. That 50-customer gap is what management should discuss, along with whether the hiring delay is a cost decision or a growth risk. A static budget would have shown April as a favorable revenue variance and said nothing about the next eleven months. To explain each month's gap between forecast and actual, apply the methods in our guide to variance analysis best practices.
A rolling forecast changes every month, so governance decides whether people trust it. The COSO Internal Control framework, "originally issued in 1992 and refreshed in 2013," treats monitoring as "one of the five components of effective internal control" (COSO). The same thinking applies to a forecast that drives spending and hiring.
Practical controls, offered as guidance:
Present the results in one place. A business intelligence dashboard for accounting KPIs can show the current forecast, the prior version and actuals side by side, and a working capital view helps translate forecast changes into cash timing.
Most first implementations start in a spreadsheet. Microsoft's Excel forecasting functions, including FORECAST.ETS and FORECAST.LINEAR, "can be used to predict future values based on historical data," and the reference page lists Excel for Microsoft 365, Excel 2024, 2021, 2019 and 2016 (Microsoft Support). These statistical functions help with trend baselines; the driver logic still needs to be built by hand.
Spreadsheets get harder to control as contributors multiply, with broken links between tabs and hours spent pasting actuals. Our comparison of Excel and accounting software covers that tipping point, and our review of budgeting tools for growing companies compares dedicated planning platforms.
When you evaluate a planning tool, check four things: a direct connection to your accounting system for actuals, version locking, driver-level assumptions with scenario switching, and permissions that let department heads edit their own drivers only.
Too much detail. Teams copy the full budget into the rolling model and then cannot update it monthly. Cut back to drivers and summary lines.
Late actuals. If the close slips, the roll slips, so fix the close before increasing cadence.
Forecast treated as a target. When managers are judged against the forecast, they tend to pad it. Keep evaluation tied to the budget or to separate targets, consistent with the Lorain findings above.
No one owns the drivers. Finance ends up guessing sales and hiring inputs. Assign owners in phase 1 and put the roll dates in their calendars.
Limited internal capacity. Some teams lack the hours to run a monthly roll. Outsourcing the model maintenance is one option; see our guide to budgeting and forecasting outsourcing.
How often should a rolling forecast be updated? Monthly or quarterly are the common cadences. Monthly suits businesses with a fast close and fast-moving drivers; quarterly suits slower businesses or small teams.
What is the best horizon for a rolling forecast? Twelve months is the common starting point, and many companies use 12 to 18 months. Choose 18 months if a seasonal peak or major contract sits just beyond a 12-month view.
Can a rolling forecast replace the annual budget? Some companies drop the annual budget, but the studies cited above found rolling forecasts used alongside the budget. The budget sets targets and evaluation; the rolling forecast guides resource decisions during the year.
How many drivers should the model have? No official number exists. As guidance, most small and mid-sized businesses work well with five to fifteen drivers that have clear owners and measurable history, consistent with AFP's warning that each added calculation adds room for error.
How long does a rolling forecast implementation take? It depends on data quality and the number of contributors. As practical guidance, a small company with a reliable close can design the model in one quarter and run pilot rolls in the next.
Do I need special software to run a rolling forecast? No. A well-structured spreadsheet works for a first implementation. Dedicated planning software becomes worth it when several departments contribute and version control gets hard to manage.
Madras Accountancy supports US businesses and CPA firms with bookkeeping, monthly close, CFO and advisory work, budgeting and forecasting. If you want help setting up the close and model behind a rolling forecast, contact our team.
The section 4960 excise tax is 21% of nonprofit pay over $1M. From 2026 it covers all employees. See the medical carve-outs, Form 4720 and a worked example.

The paid family and medical leave tax credit is permanent from 2026. See the 12.5% to 25% rates, the premium option, the 6-month rule and how Form 8994 works.
Opportunity zones become permanent in 2027 under the One Big Beautiful Bill. See the new deferral, rural bonus, and the 2026 handoff.