Monthly recurring revenue is a core signal for any SaaS company. It shows growth, but it does not tell the full story. To run a stable business, you also need to see retention, margins, payback, efficiency, and cash use. This guide gives a simple dashboard with six metrics beyond MRR. Each metric includes what it shows, how to calculate it, and a short list of actions.
MRR can rise while unit economics weaken. Marketing can spend more to add low quality customers. Expansion can hide churn. Discounts can lift MRR but reduce margin. These gaps do not show in a single line. A focused set of six metrics fills those gaps and helps leaders act early.
Keep the data model simple. Pull bookings and churn from your billing tool, pipeline and bookings from your CRM, and cost lines from the general ledger. Use shared codes for customer, plan, region, and product. Refresh the dashboard every month after close. Keep one owner per metric so questions get answers fast.
NRR shows how much revenue you keep and grow from the same group of customers over a period. It includes upgrades and cross sell, and it subtracts downgrades and churn. Strong NRR means the product delivers rising value.
Start with beginning period recurring revenue from existing customers. Add expansion. Subtract contraction and churn. Divide by the beginning value.
NRR = (Beginning ARR from existing customers + Expansion − Contraction − Churn) ÷ Beginning ARR from existing customers.
Gross margin shows the share of revenue left after direct costs to deliver the service. It funds product, sales, and admin. A weak margin limits growth and raises cash needs.
Gross margin = (Revenue − Cost of revenue) ÷ Revenue.
Include hosting, support tied to delivery, third party licenses, and any delivery staff that scale with usage.
Customer acquisition cost payback shows how fast gross profit from a new cohort pays back sales and marketing spend. It links growth to cash timing. Shorter payback reduces risk and frees budget.
For a period, take new ARR added. Multiply by gross margin to get gross profit from that ARR. Divide the period’s sales and marketing spend by that gross profit. Convert to months.
Payback (months) = Sales and marketing spend ÷ (New ARR × Gross margin) × 12 if using annual values.
The magic number estimates how much new ARR you gained for each dollar of sales and marketing in the prior quarter. It is a fast health check on growth spend.
Take the change in ARR from last quarter to this quarter, annualize it by multiplying by four, and divide by prior quarter sales and marketing spend.
Magic number = ((ARR this quarter − ARR last quarter) × 4) ÷ Sales and marketing spend last quarter.
The quick ratio compares growth from new and expansion to losses from churn and contraction. It shows if growth is healthy or if churn is burning through gains.
Quick ratio = (New ARR + Expansion ARR) ÷ (Churned ARR + Contraction ARR).
Use the same period and definitions for all four inputs.
Burn multiple shows how much cash you burn to add a dollar of new ARR. It ties growth to cash use and helps plan runway.
Burn multiple = Net cash burn in period ÷ Net new ARR in period.
Use cash burn from your cash flow view, not only the P&L. For early stage teams, a lower number shows more efficient growth.
A dashboard works when it drives action. Give each metric a clear target range and an owner. Hold a monthly review with a short deck that shows trend lines, one slide per metric, and the top three actions for the next month. Keep a log of actions taken and results seen. Over time, the link between work and results becomes clear, and planning improves.
Publish a first version of the dashboard this month. Start with NRR, gross margin, CAC payback, magic number, quick ratio, and burn multiple. Add MRR and cash on a summary page so leaders see the full picture. Set targets for the next two quarters and assign owners. Run the first monthly review and agree on three actions. Repeat the cycle. Each month, the dashboard will guide better choices on pricing, product, and spend.

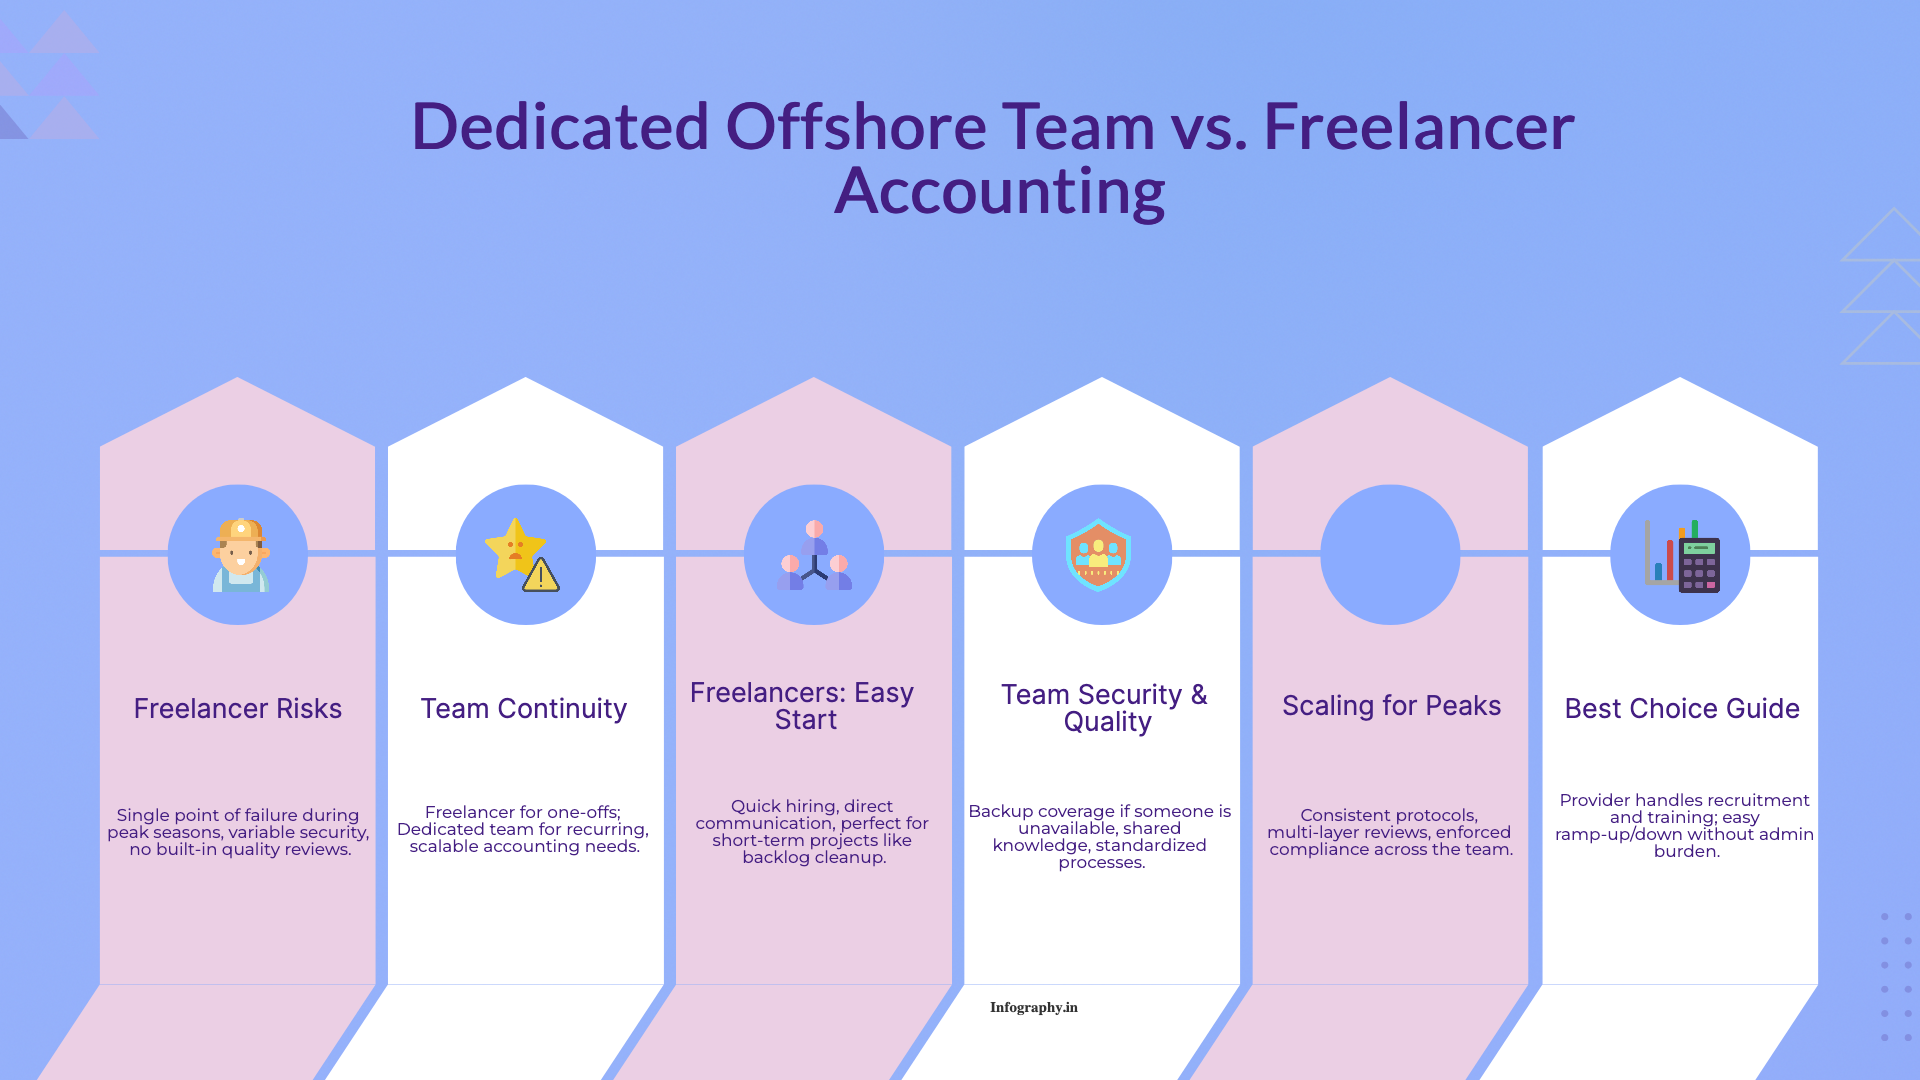
A practical comparison of hiring a freelancer vs using a dedicated offshore accounting team, focusing on continuity, quality control, security, and scaling.

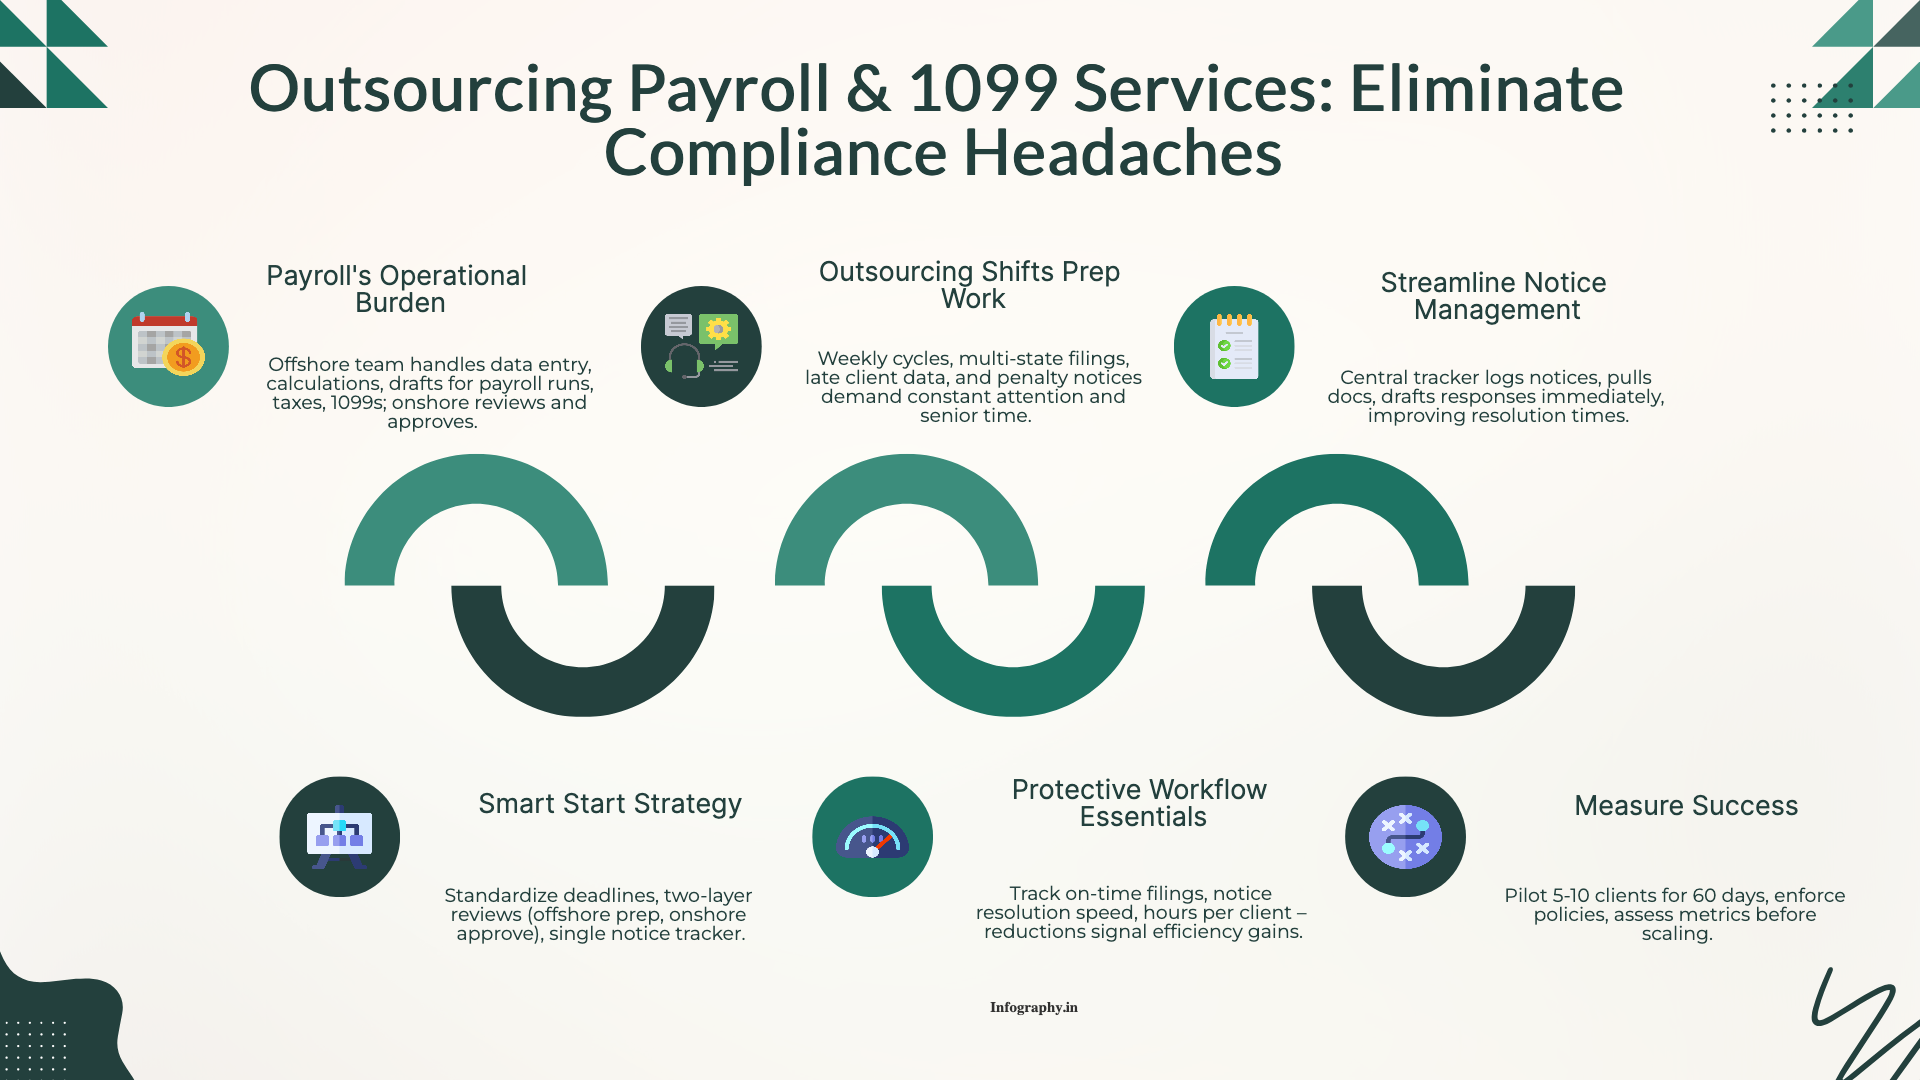
How CPA firms outsource payroll and 1099 work to reduce penalties and admin load, with a clean workflow for approvals, filings, and year-end reporting.

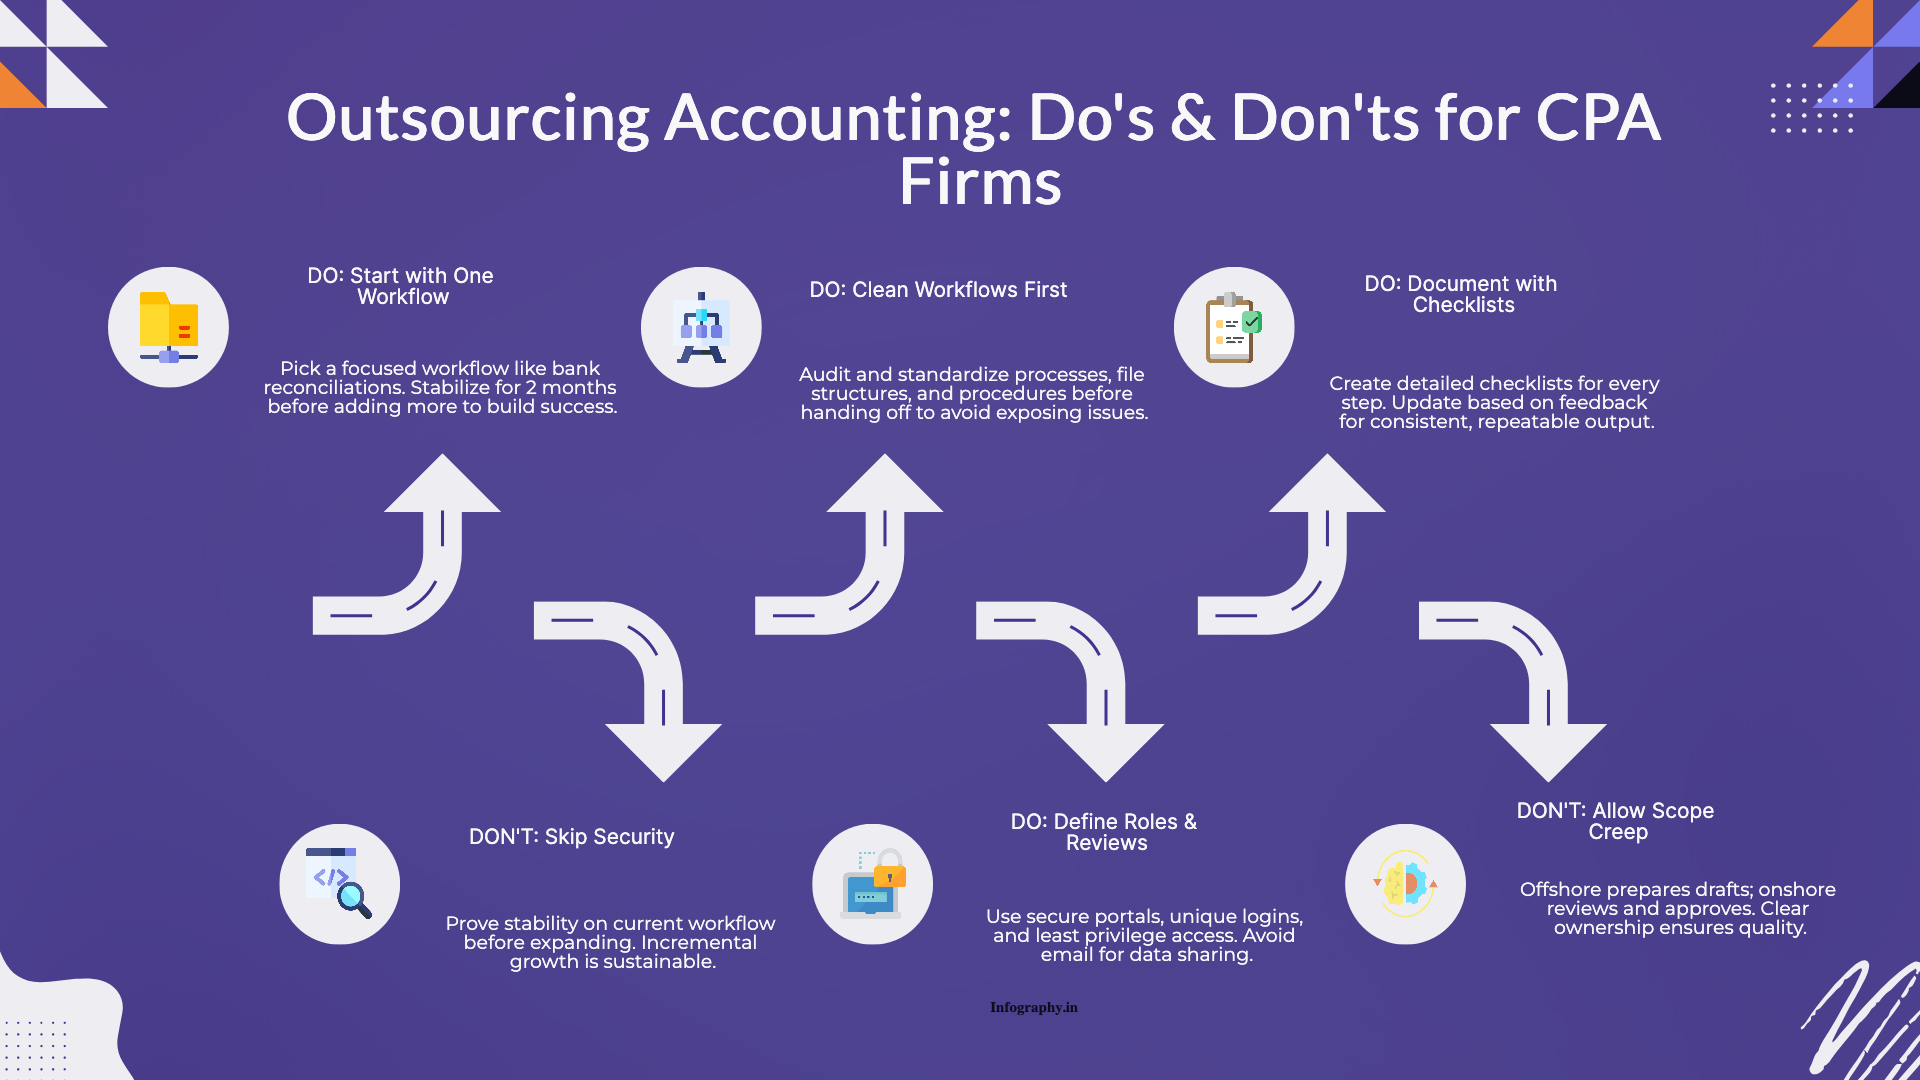
Practical do's and don'ts for CPA firms outsourcing accounting work, based on common failure points and what successful rollouts do differently.