.png)

Variance analysis serves as your financial early warning system, helping you understand what's really happening in your business compared to what you planned. When actual results differ from your budget or forecast, variance analysis helps you figure out why and what to do about it.
Most finance teams know they should be doing variance analysis, but many struggle to make it truly useful. Too often, variance reports become just another administrative task that gets filed away without driving real business improvements. The difference between effective and ineffective variance analysis lies in how you approach the process.
The best variance analysis goes beyond simply calculating differences between budget and actual numbers. It focuses on understanding the root causes behind those differences and using that insight to improve future planning and operational decision-making.
When done right, variance analysis becomes a powerful tool for financial management that helps you spot trends early, identify opportunities for improvement, and make better data-driven decisions throughout your organization.
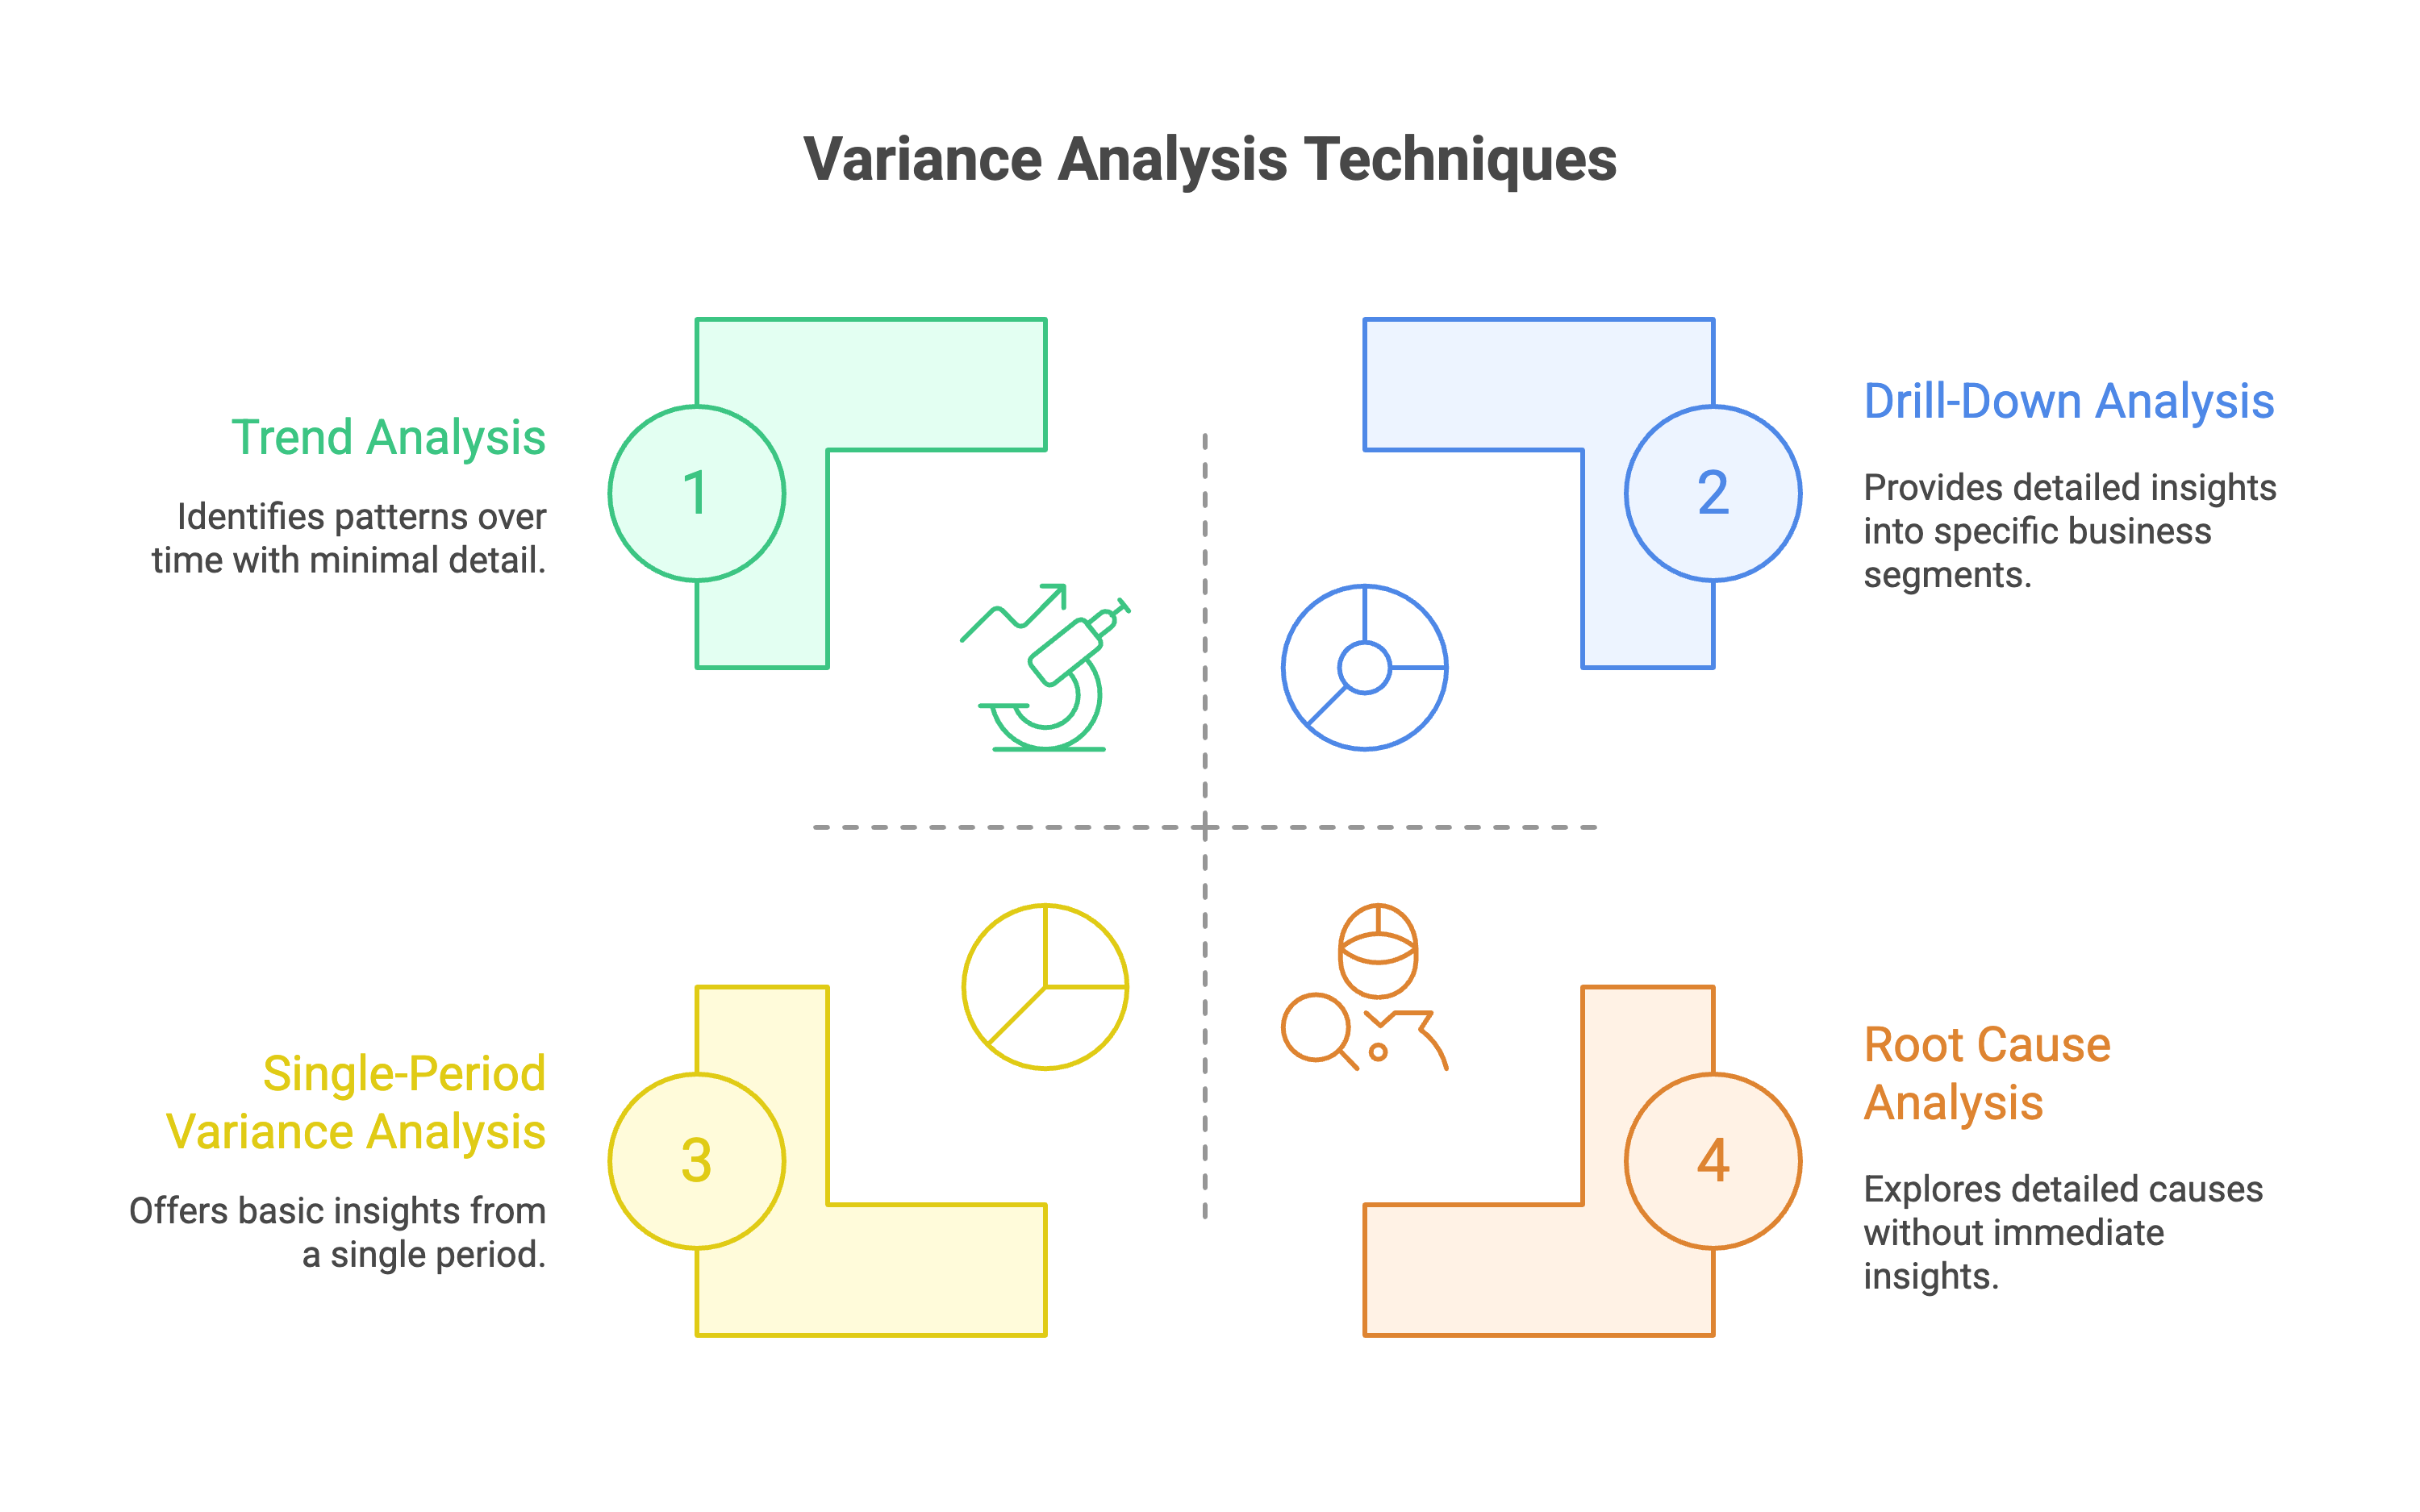
Understanding the common types of variance helps you categorize and analyze differences more effectively. Revenue variance shows you how sales performance differs from expectations, while expense variance reveals where your costs are running higher or lower than planned.
Volume variance occurs when you sell more or fewer units than budgeted, regardless of price changes. This type of variance helps you understand demand patterns and capacity utilization. Price variance, on the other hand, shows the impact of charging different prices than originally planned.
Efficiency variance measures how well you're using resources compared to standard expectations. This might involve labor efficiency in manufacturing or time utilization in service businesses. Material variance tracks differences in the cost or usage of raw materials or supplies.
Each type of variance tells a different story about your business performance. By categorizing variances properly, you can focus your analysis efforts on the areas that matter most and develop targeted action plans for improvement.
A favorable variance means actual results were better than planned, while an unfavorable variance indicates performance fell short of expectations. However, the interpretation isn't always straightforward, and context matters significantly in understanding what these variances really mean.
Favorable variance in expenses might indicate cost savings, but it could also suggest that you're not investing enough in critical areas like marketing or maintenance. Similarly, unfavorable revenue variance obviously needs attention, but unfavorable expense variance might sometimes reflect necessary investments in growth.
The key is looking beyond the favorable or unfavorable label to understand the underlying business drivers. A positive variance in one area might be offset by negative impacts elsewhere, requiring a holistic view of business performance.
Timing differences can also create misleading variance signals. Expenses that occur later than planned might create favorable variances in the short term but could indicate execution problems that will affect future periods.
Not every variance deserves the same level of attention. Setting materiality thresholds helps you focus on differences that actually matter for business performance while avoiding analysis paralysis on minor fluctuations.
Materiality can be defined in absolute dollar terms, percentage differences, or a combination of both. A $1,000 variance might be material for a small business but insignificant for a large corporation. Similarly, a 50% variance in a small budget line item might be less important than a 5% variance in a major expense category.
Consider both the size of the variance and its potential business impact when setting thresholds. Some small variances might indicate systemic issues that could grow over time, while large variances in predictable seasonal patterns might not require immediate action.
Document your materiality thresholds and apply them consistently to ensure that your analysis efforts are focused on the most important issues. This consistency also helps train your team to prioritize their time effectively.
The most valuable part of variance analysis happens when you dig deeper to understand why differences occurred. Root cause analysis helps you identify the fundamental drivers behind variances rather than just documenting their existence.
Start by asking "why" multiple times for each significant variance. If revenue is below budget, ask why. If the answer is lower volume, ask why volume was low. If the answer is competitive pressure, ask why competitors were more successful. This process helps you get to actionable insights.
Look for patterns across different variance categories. Sometimes what appears to be a revenue problem is actually caused by operational issues, or cost variances might be driven by volume changes rather than efficiency problems. These connections often reveal the most important improvement opportunities.
External factors like market conditions, regulatory changes, or economic trends can drive variances across multiple areas. Identifying these external drivers helps you adjust your expectations and planning assumptions for future periods.
Single-period variance analysis only tells part of the story. Trend analysis helps you understand whether variances represent one-time events or ongoing patterns that require different types of responses.
Consistent unfavorable variances in the same area might indicate systematic problems with your budgeting assumptions or operational processes. Conversely, variances that swing back and forth might suggest timing issues or seasonal patterns that you need to account for in future planning.
Rolling variance analysis over multiple periods can reveal trends that aren't visible when looking at individual months or quarters. Some variances might cancel out over longer periods, while others might be building toward larger problems.
Use visual tools like charts and graphs to make variance patterns more apparent. Financial performance dashboards can help stakeholders quickly identify trends and focus their attention on areas that need immediate action.
Aggregate variance numbers often hide important details about what's really happening in different parts of your business. Segmenting your analysis by product line, customer type, geographic region, or other relevant dimensions provides much more actionable insights.
A favorable overall revenue variance might mask serious problems in specific product lines or customer segments. Similarly, cost variances that look reasonable at the company level might reveal significant inefficiencies in particular departments or locations.
Drill-down analysis capabilities in your financial systems help you quickly move from high-level variance summaries to detailed transaction-level information. This capability is essential for conducting thorough root cause analysis and developing targeted improvement plans.
The level of detail in your analysis should match the level of management responsibility and decision-making authority. Department managers need detailed analysis of their specific areas, while executive leadership might focus on high-level trends and strategic implications.
Effective variance reports tell a clear story about business performance and provide specific recommendations for action. The structure should guide readers from high-level summaries through detailed analysis to specific next steps.
Start with an executive summary that highlights the most important variances and their business implications. Use clear, non-technical language that explains what the numbers mean and why they matter. Avoid accounting jargon that might confuse non-financial stakeholders.
Present variances in both absolute and percentage terms to provide proper context. A $10,000 variance might seem large until you realize it represents only 1% of the total budget. Similarly, a 25% variance might not seem significant until you see that it represents $100,000.
Use consistent formatting and presentation standards across all your variance reports. This consistency helps readers quickly find the information they need and compare performance across different periods or business units.
The best variance reports don't just explain what happened in the past - they help predict what's likely to happen in the future based on current trends and identified drivers. This forward-looking perspective makes variance analysis much more valuable for decision-making.
Update your forecasts based on variance analysis insights. If you've identified new trends or drivers, incorporate them into your projections for the remainder of the year. This updated forecasting helps management make better resource allocation and strategic decisions.
Consider the cumulative impact of variances over time. A small monthly variance might not seem important, but if it continues for a full year, the cumulative effect could be significant. Help stakeholders understand these longer-term implications.
Scenario analysis can help quantify the potential range of outcomes based on different assumptions about variance drivers. This analysis is particularly valuable when dealing with uncertain external factors or when variances might accelerate or decelerate.
Different stakeholders need different levels of detail and different types of insights from variance analysis. Tailor your communication to match the audience's needs and decision-making responsibilities.
Operations managers need detailed analysis of operational drivers and specific recommendations for process improvements. Financial executives might focus more on cash flow implications and strategic impacts. Board members typically want high-level summaries with clear explanations of business implications.
Establish regular follow-up processes to track whether recommended actions are being implemented and whether they're having the expected impact on performance. This follow-up closes the loop and ensures that variance analysis leads to real business improvements.
Document lessons learned from variance analysis and incorporate them into your budgeting and planning processes. Over time, this continuous improvement approach helps you develop more accurate budgets and better operational processes.
Modern variance analysis relies heavily on automated data collection and calculation to ensure accuracy and timeliness. Manual variance calculations are prone to errors and consume too much time that could be spent on analysis and action planning.
Integration between budgeting systems, accounting software, and reporting tools eliminates manual data transfer and ensures that variance analysis uses consistent, up-to-date information. This integration also enables real-time or near real-time variance reporting.
Automated variance calculation and reporting free up your team to focus on the more valuable activities of root cause analysis, trend identification, and recommendation development. This shift in focus typically leads to much better business outcomes from your variance analysis efforts.
However, automation doesn't eliminate the need for human judgment and business knowledge. The most effective approach combines automated data processing with skilled analysis and interpretation by finance professionals who understand the business context.
Visual presentation of variance information makes it much easier for stakeholders to quickly identify trends and areas requiring attention. Well-designed dashboards can highlight the most important variances and provide drill-down capabilities for detailed analysis.
Use color coding and exception reporting to draw attention to variances that exceed your materiality thresholds. This visual approach helps busy executives quickly focus on the issues that matter most without getting lost in detailed numbers.
Interactive dashboards allow users to explore variance data from different perspectives and drill down into the details that are most relevant to their responsibilities. This self-service capability reduces the burden on the finance team while empowering other managers to use variance information more effectively.
Mobile-friendly dashboards enable variance monitoring and analysis from anywhere, which is particularly valuable for organizations with multiple locations or remote management teams.
Q: How often should variance analysis be performed? A: Most organizations benefit from monthly variance analysis, with some key metrics reviewed weekly or even daily. The frequency should match your business cycle and decision-making needs. Fast-moving businesses might need more frequent analysis, while stable operations might find quarterly analysis sufficient.
Q: What's the difference between budget variance and forecast variance? A: Budget variance compares actual results to your original annual budget, while forecast variance compares actuals to your most recent forecast or projections. Forecast variance is often more useful for current decision-making since it reflects updated expectations based on year-to-date performance.
Q: How do you determine if a variance is significant enough to investigate? A: Establish materiality thresholds based on both absolute amounts and percentages. A common approach is to investigate variances exceeding $10,000 or 10% of budget, but thresholds should be tailored to your organization's size and risk tolerance. Also consider the potential business impact beyond just the dollar amount.
Q: What should you do when variances are consistently unfavorable? A: Persistent unfavorable variances indicate either unrealistic budget assumptions or systematic operational issues. Conduct thorough root cause analysis to identify the underlying drivers, then either adjust future budgets to reflect realistic expectations or implement process improvements to address operational problems.
Q: How can variance analysis improve future budgeting accuracy? A: Use variance analysis insights to identify patterns in your budgeting accuracy, understand which assumptions tend to be wrong, and refine your budgeting methodologies. Document lessons learned and incorporate them into your next budget cycle to improve accuracy over time.
Q: What role should non-financial managers play in variance analysis? A: Non-financial managers should provide operational context for variances, help identify root causes, and take ownership of corrective actions within their areas of responsibility. They don't need to perform the calculations, but their business knowledge is essential for meaningful analysis.
Q: How do you handle variances caused by external factors beyond your control? A: Identify and document external drivers separately from internal operational variances. While you can't control external factors, understanding their impact helps with scenario planning and risk management. Focus your improvement efforts on internal factors while monitoring external trends that might affect future performance.
Q: What's the most common mistake organizations make with variance analysis? A: The biggest mistake is focusing only on calculation and reporting without dedicating enough effort to root cause analysis and follow-up action. Variance analysis is only valuable if it leads to better decision-making and improved business performance.
Compare a bookkeeper and CPA so your business knows when it needs recordkeeping, tax filing, planning, or higher-level advice.
Learn when to outsource bookkeeping, what tasks to hand off first, and how outsourced bookkeeping supports tax planning and decisions.
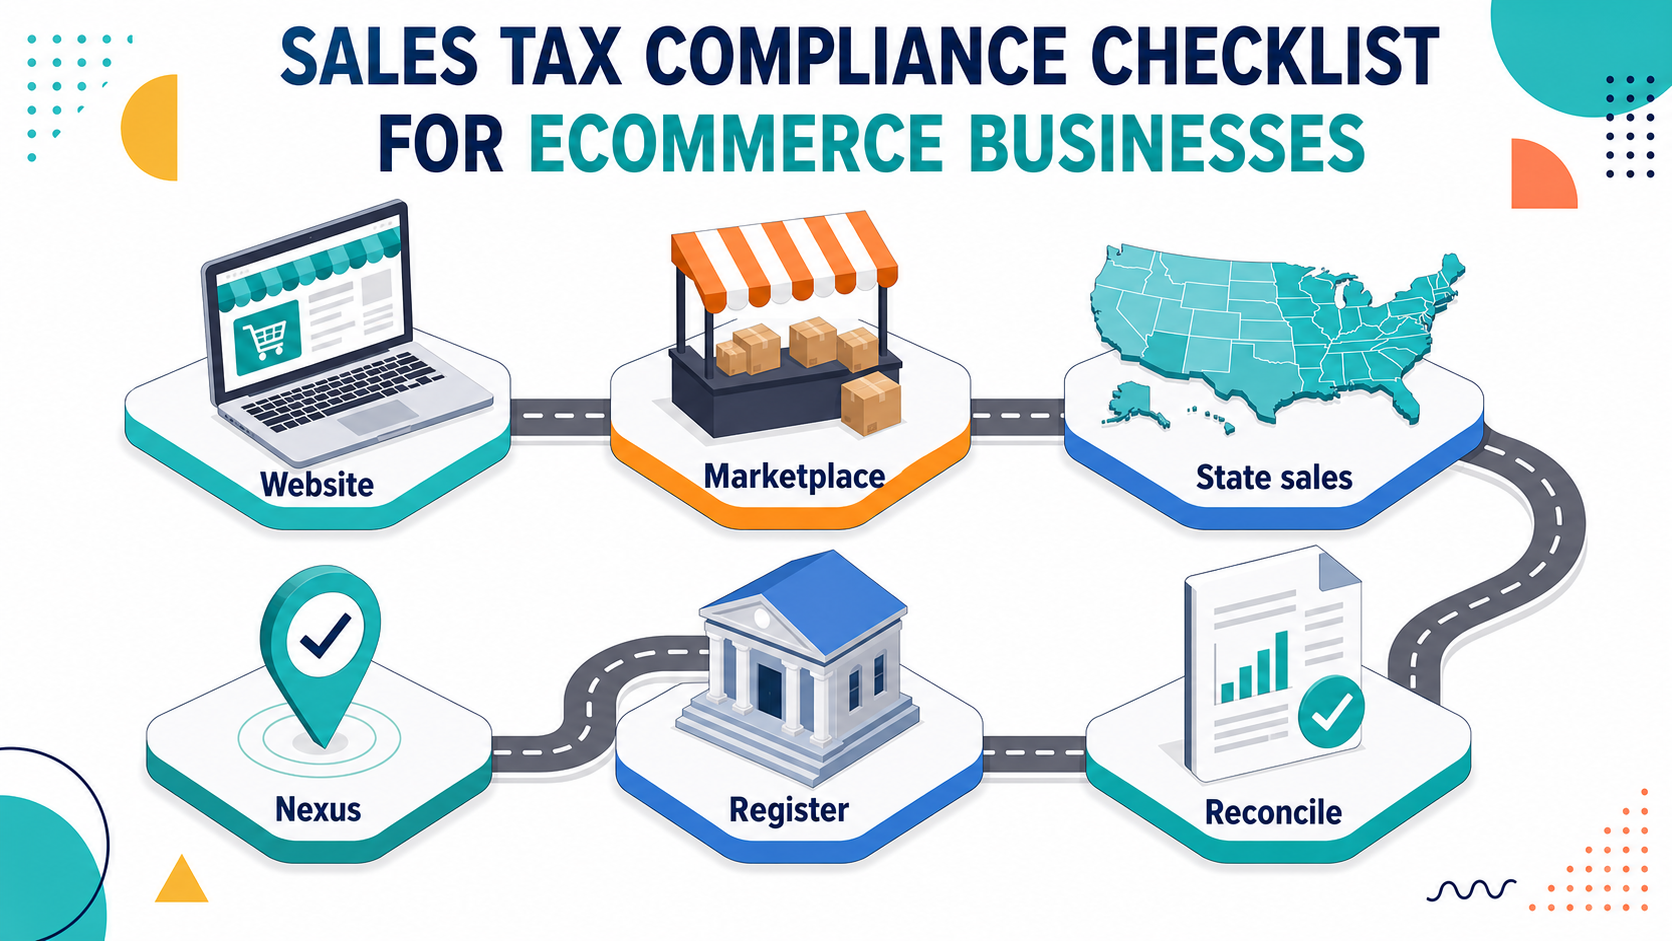
Use this ecommerce sales tax checklist to review nexus, registrations, marketplaces, product taxability, filings, and bookkeeping records.