Every month, thousands of small and mid-sized businesses close their books and file away the financial statements. Income statement, balance sheet, maybe a cash flow report if someone clicks the right button. Then they move on. The numbers did their job as a compliance task, so the thinking goes.
But buried in that same data are clues about which customers are quietly fading, which products actually carry the profit, and where expenses are creeping. You do not need a complex business intelligence stack to start seeing those patterns. You just need to look at the data in slightly different ways.
Good analytics does not begin with software. It begins with questions. What are you actually curious about right now? Maybe you want to know why cash feels tight even though sales are growing. Maybe you wonder whether a popular service line is really as profitable as it seems.
Write down two or three questions, in plain language. Then ask your accountant or controller to pull numbers that speak directly to those questions instead of handing you the standard report package. When the analysis is anchored to a real decision, it suddenly becomes easier to care about the details.
One of the simplest analytic moves is to line up several periods side by side. Instead of staring at this month's profit and loss in isolation, look at a twelve month view. Many cloud systems can show this with a few clicks. If not, export to a spreadsheet and build a basic table.
Ask what is changing. Are certain expense categories creeping up every quarter? Did revenue spike at a certain time of year last year, and is that happening again? Humans are good at spotting patterns when numbers are laid out as a series rather than a single snapshot.
Raw totals can be misleading. Spending ten thousand dollars per month on advertising might be high or low depending on whether you make fifty thousand in sales or five hundred thousand. Ratios help scale things properly.
Common useful ratios include:
Tracking these over time makes it easier to see whether changes in profit are driven by pricing, cost of goods, overhead, or collection speed.
Another powerful step is to break data into meaningful segments. Instead of one lump sales figure, look at revenue and margin by product line, by customer type, or by region. Many accounting systems support classes, locations, or tracking categories that can help with this if you set them up early.
For example, you might discover that one small group of customers generates most of your profit, while another group generates a lot of activity but almost no margin. That insight can change how you price, where you market, and even which clients you politely let go.
It is easy to go overboard with dashboards that have twenty charts and feel impressive but rarely get opened. A better approach is to pick a handful of metrics that really matter to your business stage and put them on one simple page.
For a growing service firm, that might be monthly recurring revenue, new contracts signed, average billing rate, and days sales outstanding. For a retailer, it might be same store sales, gross margin, inventory turns, and average ticket size. The goal is not to track everything. It is to track a small set of signals that tell you quickly whether you should dig deeper this month.
Data analytics only adds value when it influences choices. After reviewing a report or dashboard, force yourself to answer one question: "Given what we just saw, what are we going to do differently, if anything?" Sometimes the answer is that things are on track and no change is needed. Other times, it might be to test a price increase, tighten credit terms, or cut an underused subscription.
Over time, this habit turns your accounting function from a historical archive into a living feedback system. You are no longer just filing numbers away for the tax authorities. You are using them as a tool to steer the business. For more on building a strong chart of accounts to support analytics, see our guide.

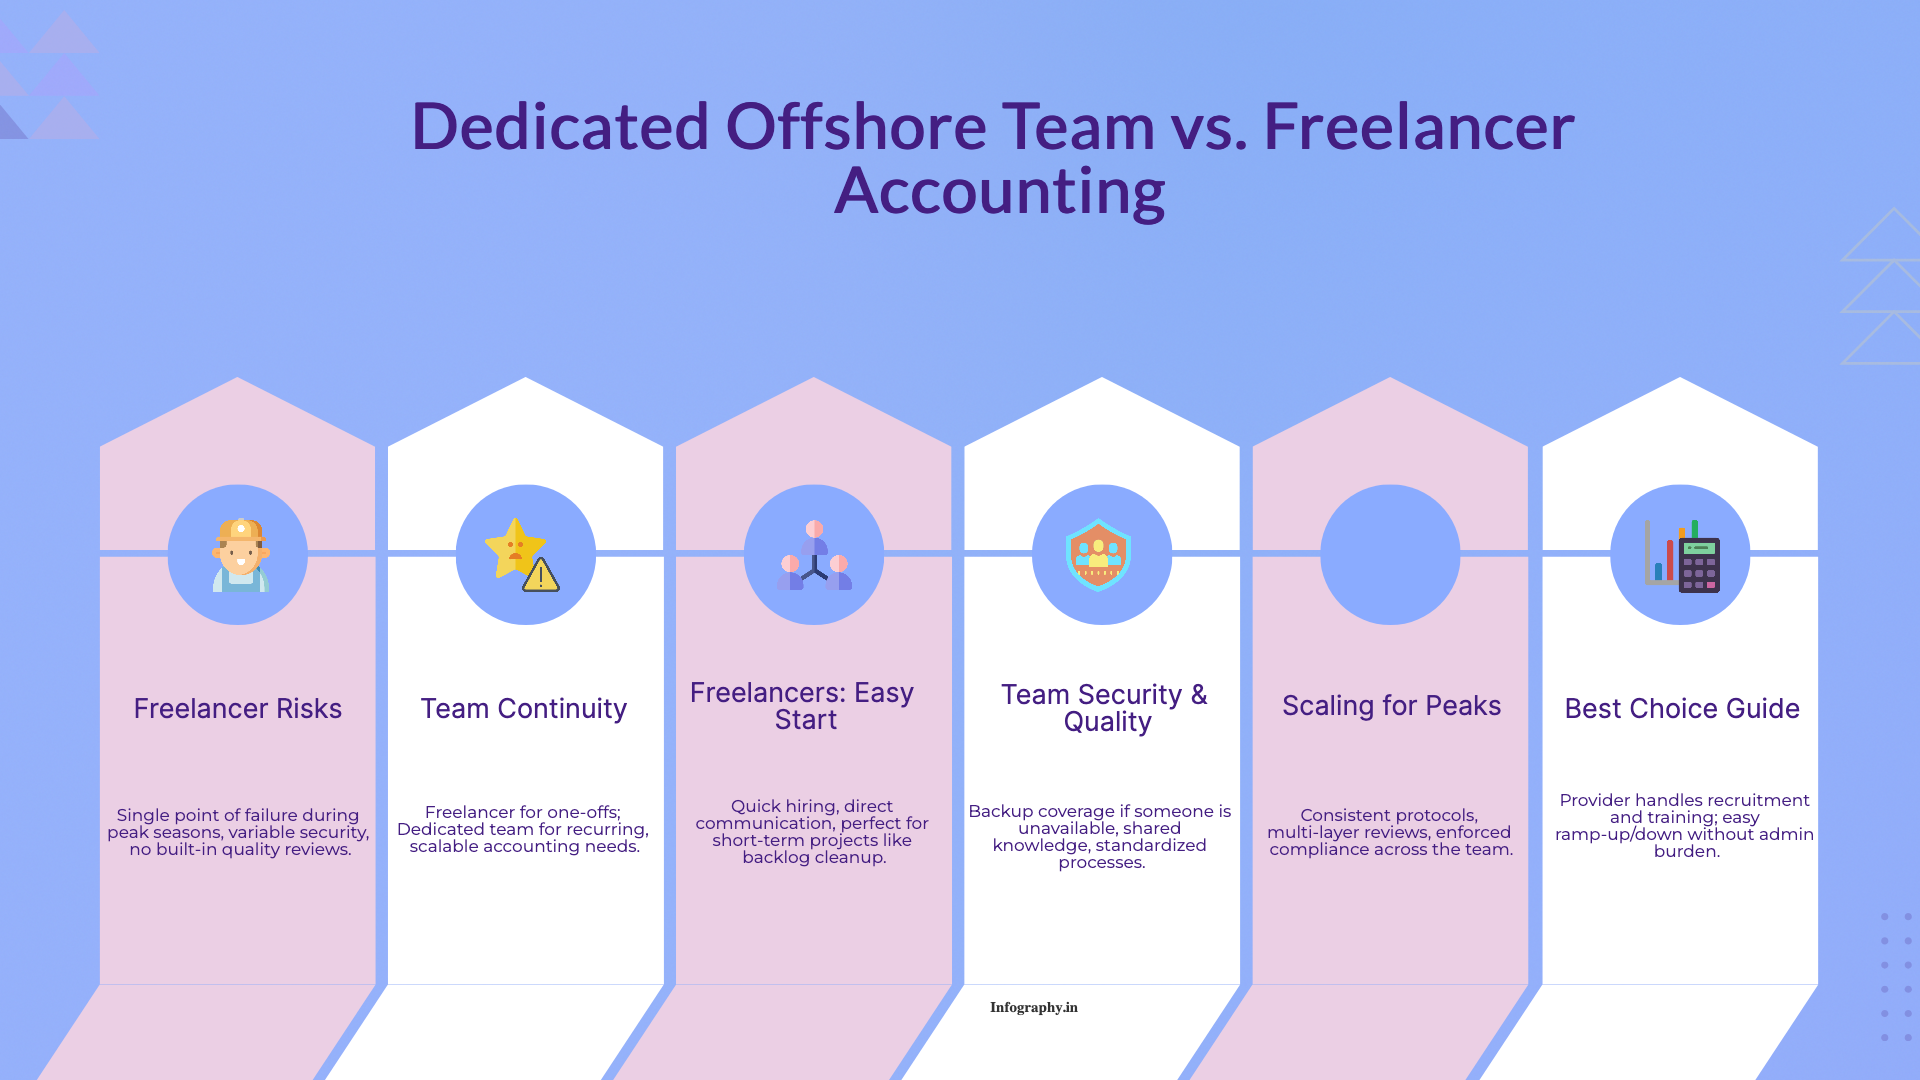
A practical comparison of hiring a freelancer vs using a dedicated offshore accounting team, focusing on continuity, quality control, security, and scaling.

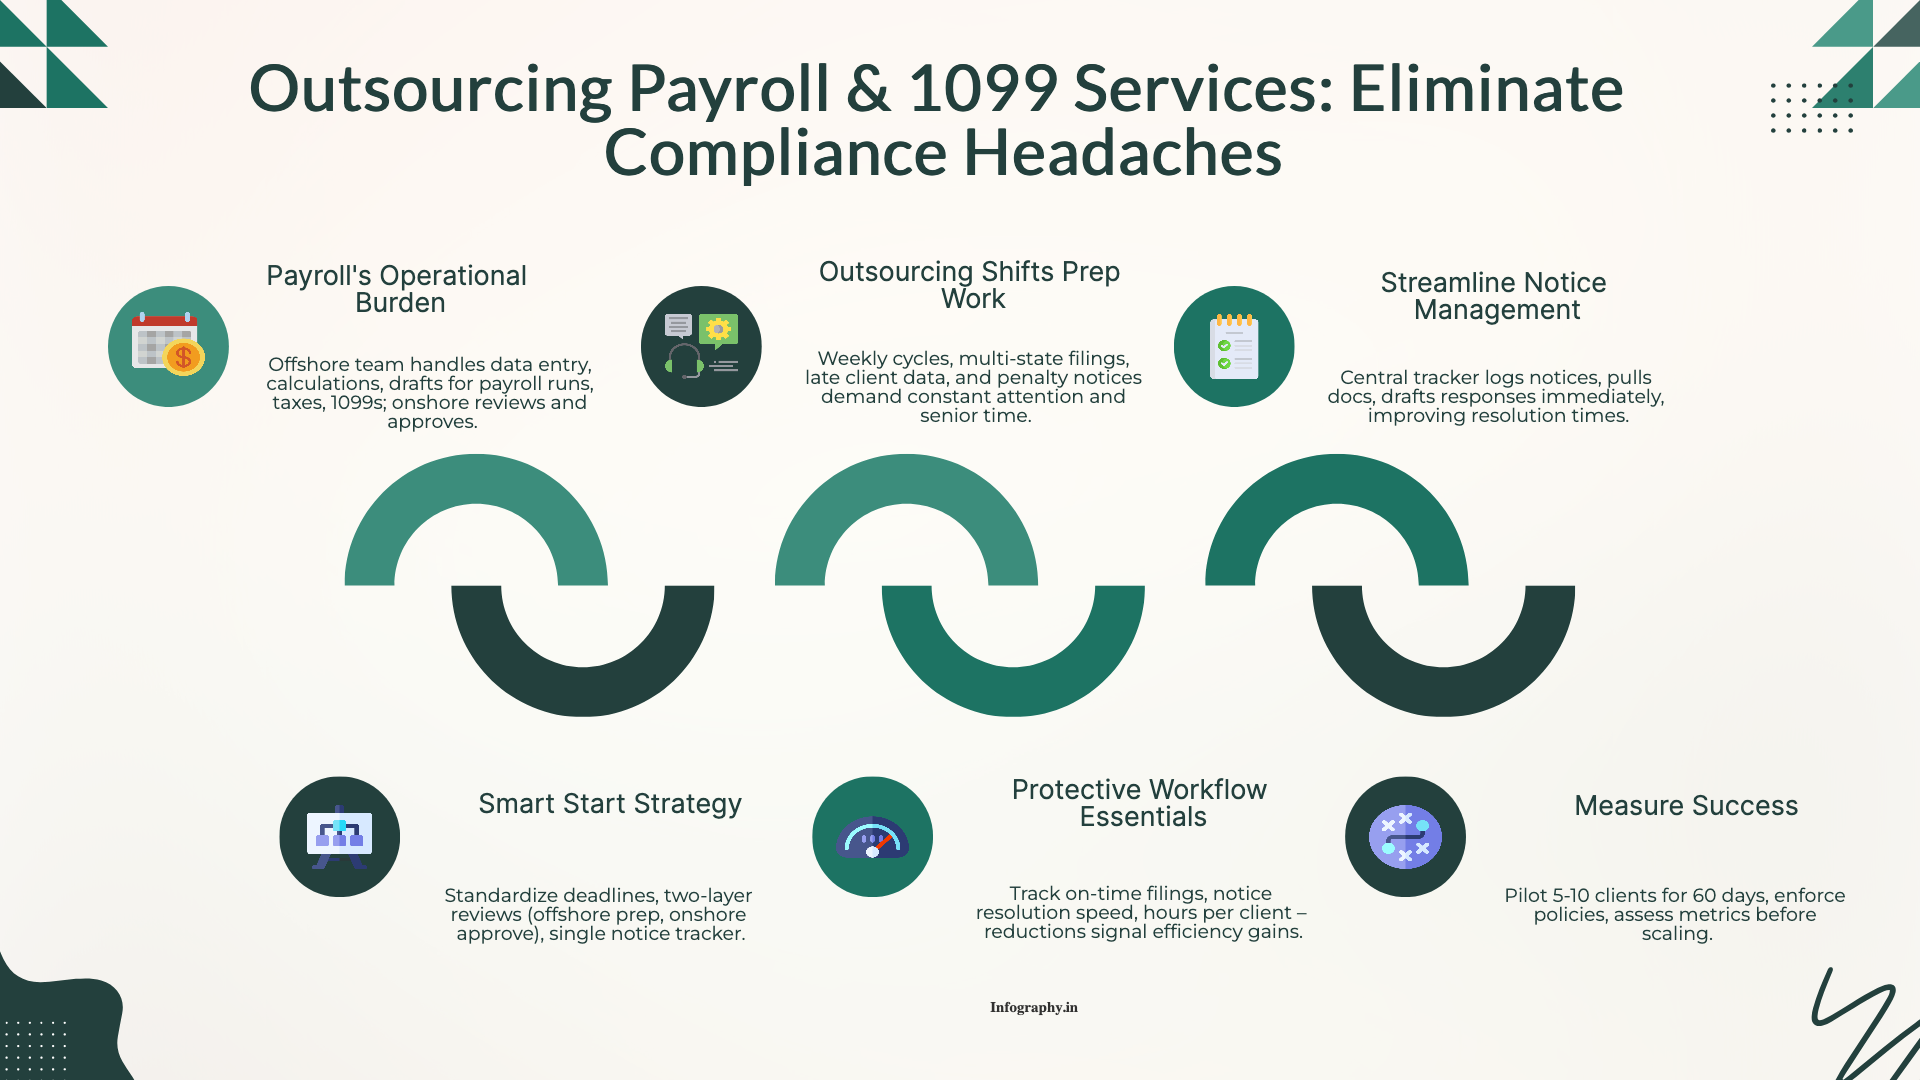
How CPA firms outsource payroll and 1099 work to reduce penalties and admin load, with a clean workflow for approvals, filings, and year-end reporting.

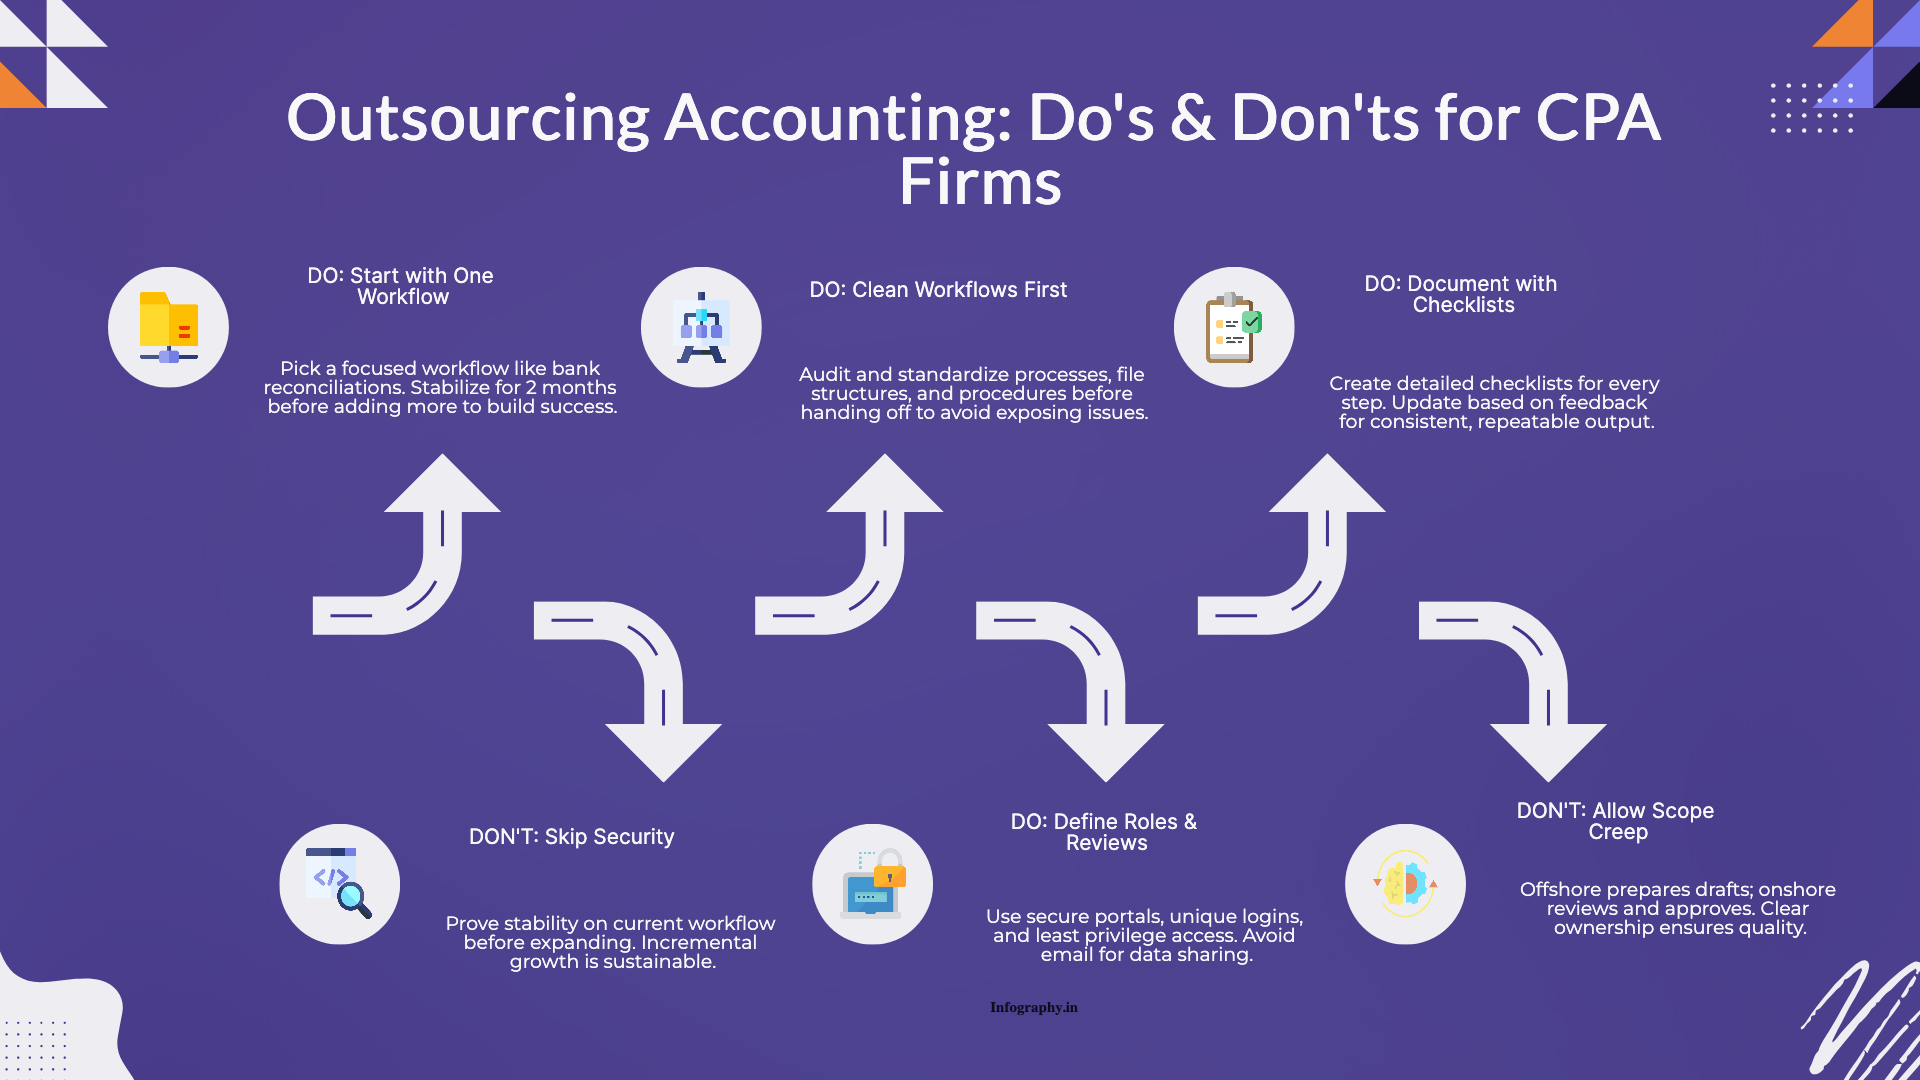
Practical do's and don'ts for CPA firms outsourcing accounting work, based on common failure points and what successful rollouts do differently.