.png)

Running a small business without financial benchmarking is like driving with your eyes closed. You might think you're doing well because you're profitable, but how do you really know if you're performing at your potential? Financial benchmarking helps you answer that critical question by comparing your performance against industry standards and competitors.
Most small business owners focus on whether they're making money, but they miss the bigger picture. Your profit margin might seem healthy until you discover that industry leaders are achieving margins twice as high as yours. That gap represents real money left on the table and growth opportunities you're not capturing.
Financial benchmark data provides the context you need to understand where your business truly stands. When you know how your key metrics compare to industry averages, you can identify specific areas for improvement and set realistic but ambitious goals for business growth.
This process isn't about comparing yourself to Fortune 500 companies. It's about understanding how similar businesses in your industry are performing and learning from their success patterns to improve your own results.
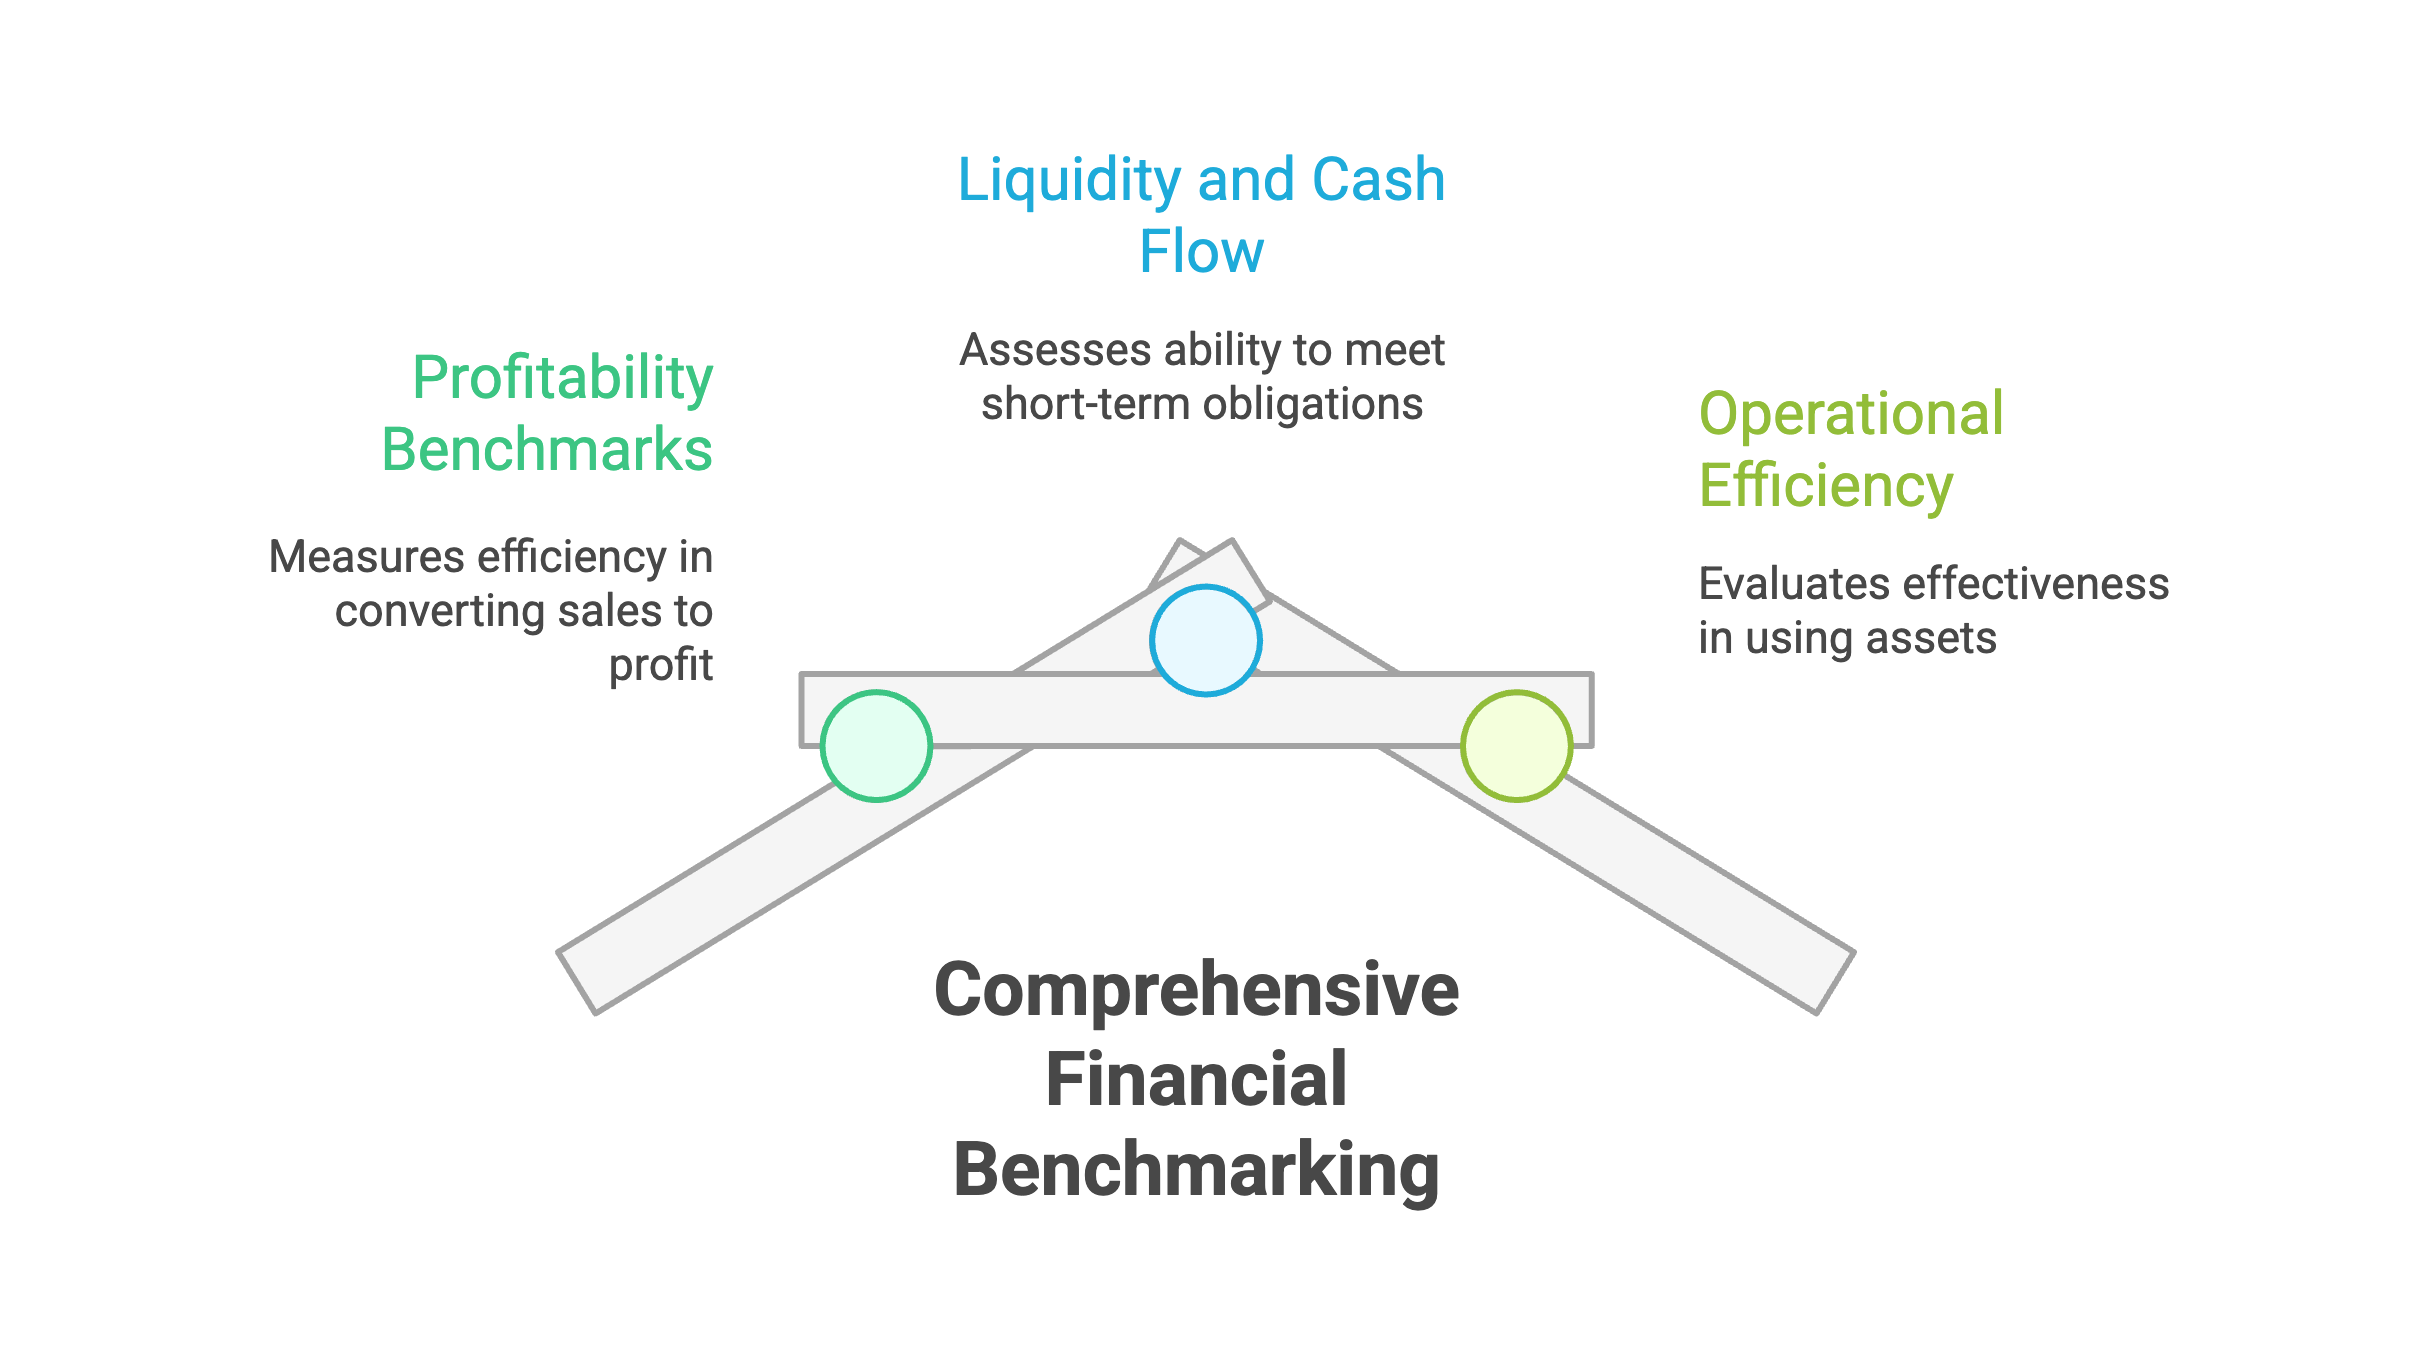
Profit margin analysis forms the foundation of effective financial benchmarking. Your gross profit margin shows how efficiently you convert sales into profit after direct costs, while net profit margin reveals your bottom-line performance after all expenses.
Industry benchmarks for profitability vary significantly across sectors. Retail businesses typically operate on lower margins than service companies, while technology companies often achieve higher margins than manufacturing businesses. Understanding these industry patterns helps you set realistic targets.
The key is comparing your profit margins to businesses of similar size and focus within your industry. A local restaurant shouldn't benchmark against a national chain, but rather against similar independent restaurants in comparable markets.
Regular profitability benchmarking also helps you spot trends early. If your margins are declining while industry averages remain stable, you can investigate specific causes and take corrective action before the problem becomes serious.
Cash flow metrics are particularly critical for small businesses because cash flow problems kill more businesses than lack of profitability. Benchmarking your cash flow performance against industry standards helps identify potential problems before they become crises.
Current ratio and quick ratio benchmarks show how your liquidity compares to industry norms. These ratios measure your ability to meet short-term obligations and provide early warning signs of cash flow stress.
Days sales outstanding (DSO) benchmarking reveals how quickly you collect payments compared to industry standards. If your DSO is significantly higher than industry averages, you might need to improve your collection processes or adjust payment terms.
Cash conversion cycle analysis shows how efficiently you turn investments in inventory and receivables back into cash. Industries with shorter cash cycles typically require less working capital, making this an important efficiency metric.
Asset turnover ratios help you understand how effectively you're using your investments in equipment, inventory, and facilities compared to similar businesses. Higher ratios typically indicate more efficient operations and better return on invested capital.
Inventory turnover benchmarking is crucial for businesses carrying significant stock. Slower turnover than industry standards might indicate obsolete inventory, poor buying decisions, or ineffective sales processes.
Employee productivity metrics, such as revenue per employee, provide insights into operational efficiency. While these metrics vary widely by industry, they help identify whether you're getting appropriate returns on your labor investments.
Fixed asset utilization ratios show how well you're using expensive equipment and facilities. Industries with high capital requirements need to monitor these ratios closely to ensure adequate returns on major investments.
Trade associations often publish annual financial studies that provide valuable benchmark data for their member industries. These reports typically include ratios broken down by company size, making them particularly relevant for small businesses.
The advantage of industry association data is that it comes from businesses similar to yours and includes context about industry trends and challenges. Many associations also provide commentary explaining why certain metrics might be changing over time.
Some associations charge for detailed reports, but the investment is often worthwhile for the quality and specificity of the information provided. Look for reports that segment data by business size to ensure you're comparing against appropriate peers.
Professional associations also sometimes provide benchmarking services or tools that allow members to submit their own data and receive customized comparison reports.
The U.S. Census Bureau publishes economic census data every five years that includes detailed financial information by industry and business size. While not as current as private sources, this data is comprehensive and freely available.
The Bureau of Labor Statistics provides productivity and cost data that can be useful for benchmarking operational efficiency. Their industry-specific reports often include metrics that aren't available from other sources.
Financial databases like Risk Management Association (RMA) Annual Statement Studies provide detailed financial ratios for hundreds of industries, with data segmented by company size and geographic region.
Many states also publish small business economic data through their economic development agencies, which can provide regional benchmarking information particularly relevant for locally focused businesses.
Several companies specialize in providing benchmarking data and analysis specifically for small businesses. These services often provide more current data than government sources and include industry-specific insights.
Online benchmarking platforms allow you to input your financial data and receive instant comparisons against industry standards. While convenient, ensure these platforms use reliable data sources and appropriate comparison groups.
Some accounting software providers include benchmarking features that automatically compare your performance against other users in similar industries. These tools can provide ongoing benchmarking without additional effort.
Professional benchmarking services can provide customized analysis tailored to your specific business model and competitive situation, though they typically require larger investments.
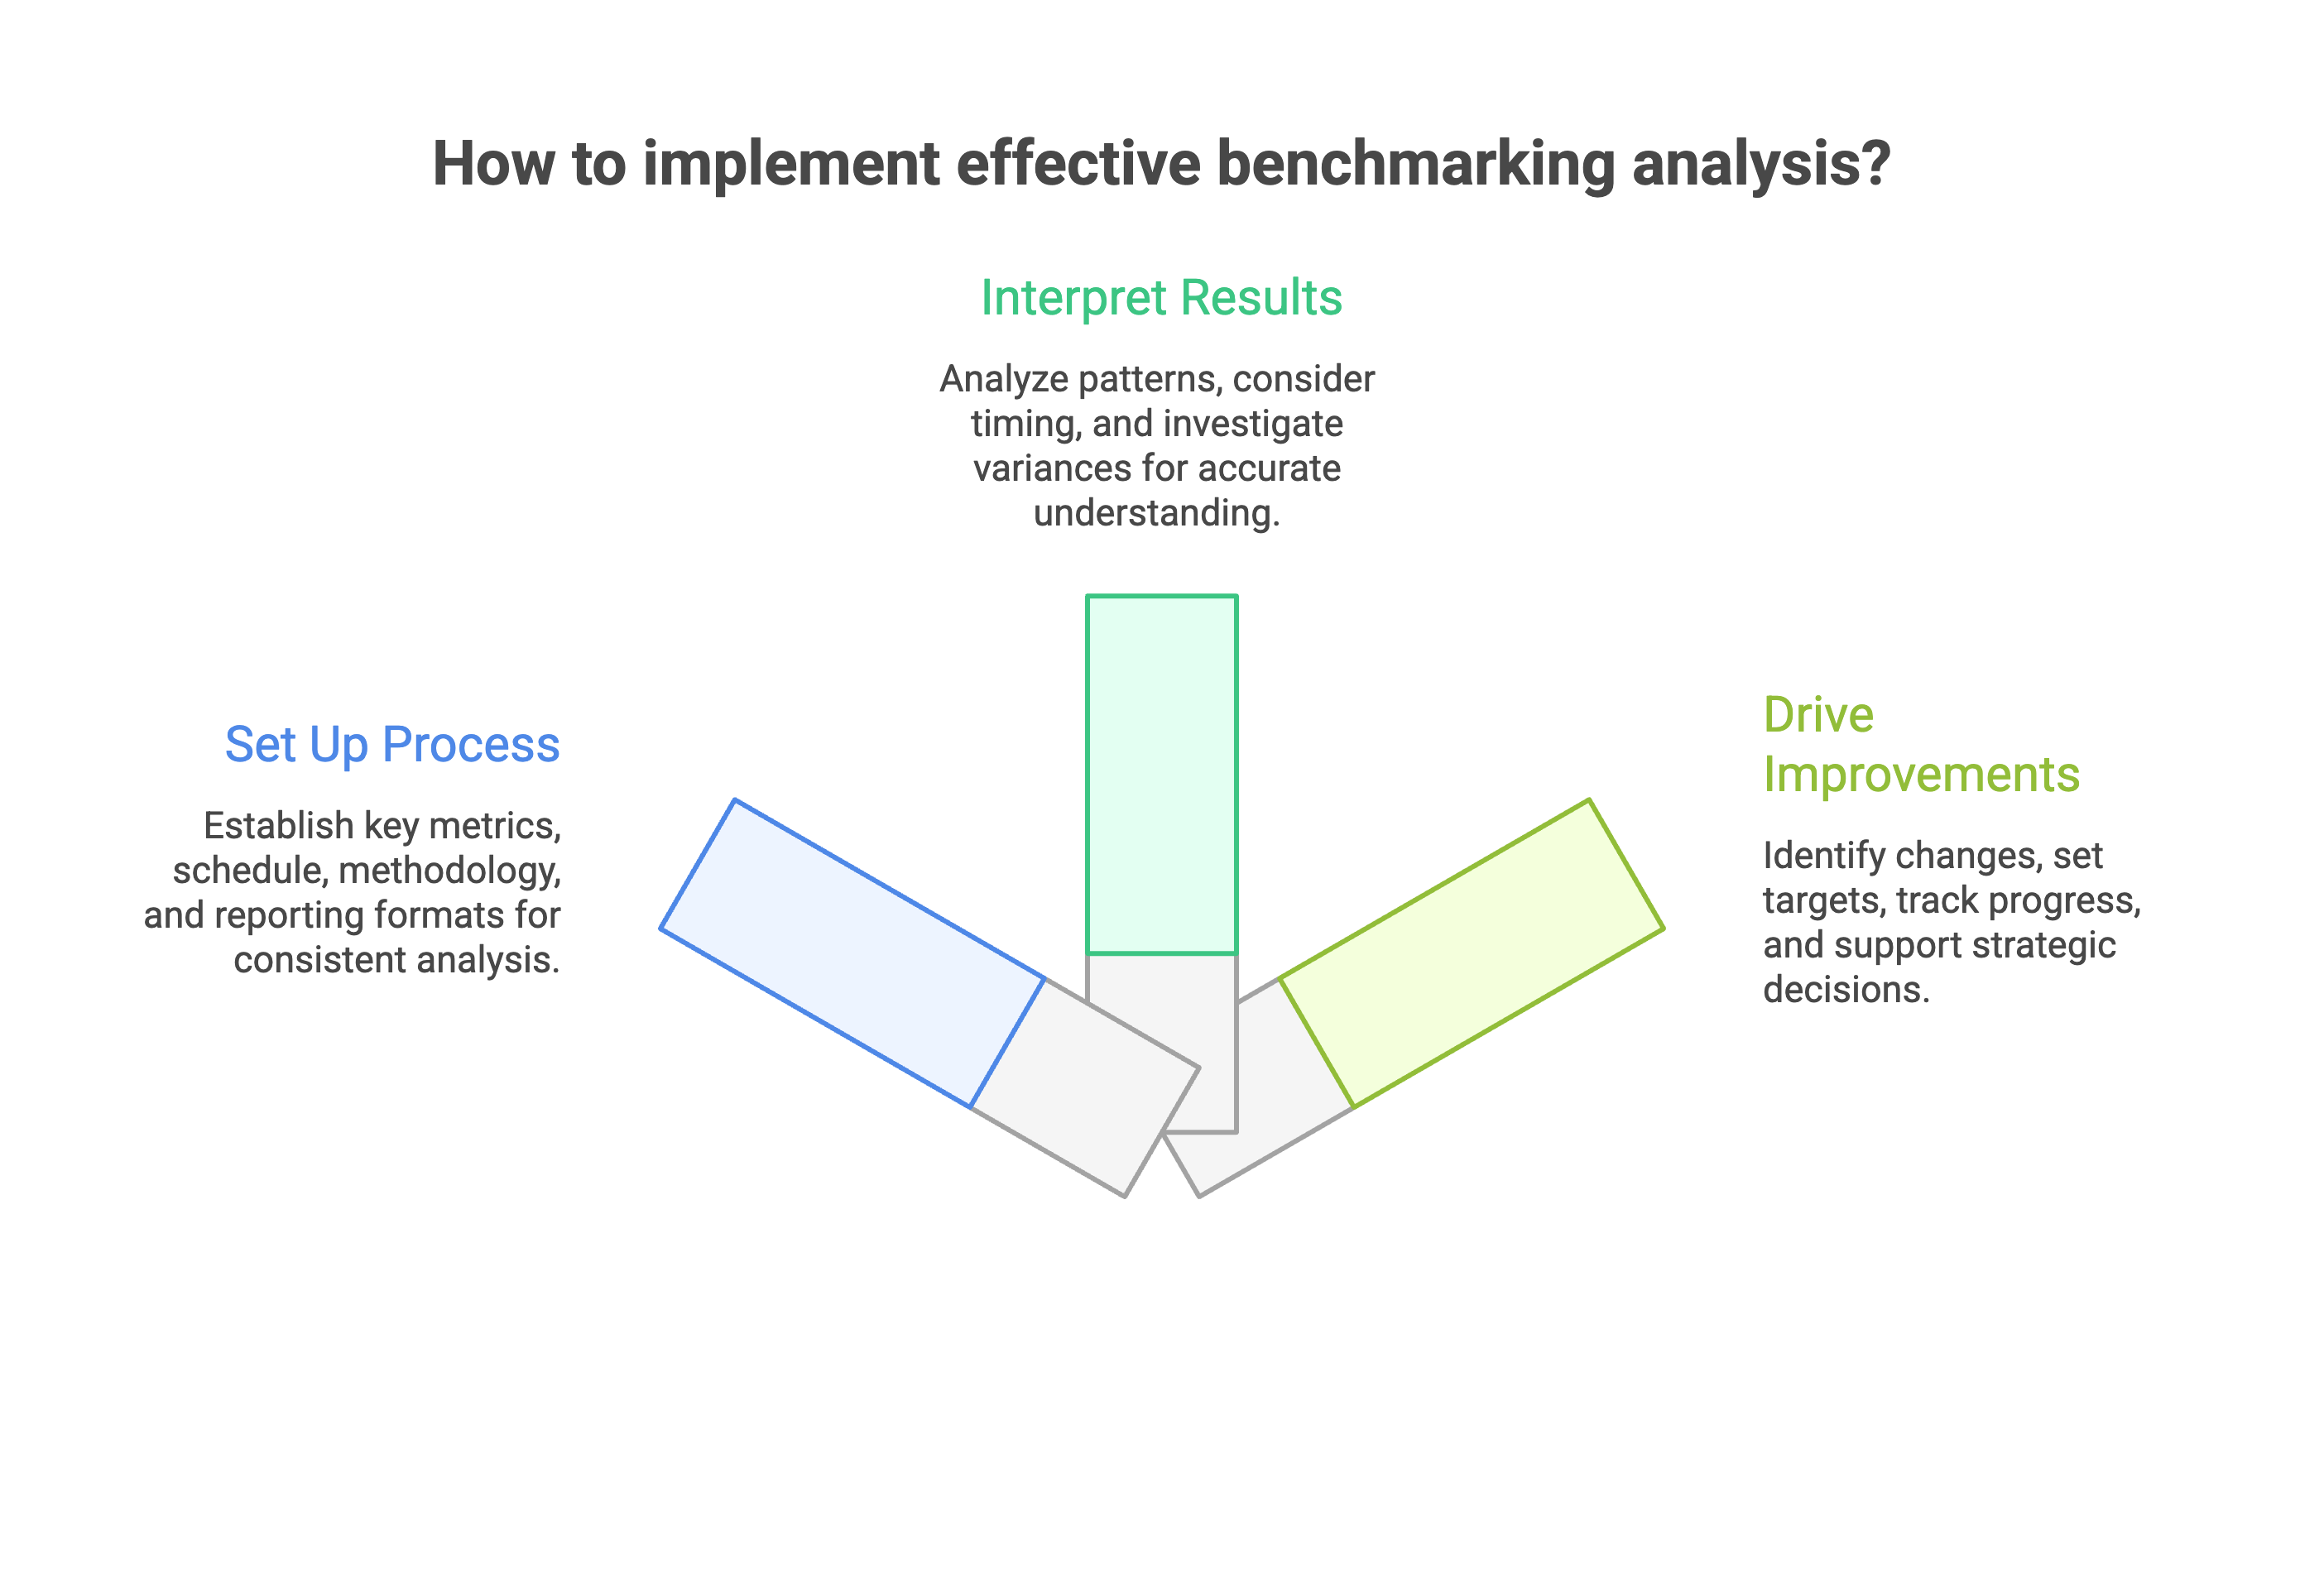
Start by identifying the key financial metrics most relevant to your business model and industry. Don't try to benchmark everything at once, focus on the ratios that most directly impact your success and profitability.
Establish a regular benchmarking schedule, whether quarterly or annually, to track your progress over time. Consistency in timing and methodology ensures that your comparisons remain meaningful and actionable.
Document your benchmarking methodology so you can replicate the analysis consistently. This documentation should include data sources, calculation methods, and the specific peer groups you're comparing against.
Create standardized reporting formats that make it easy to spot trends and share results with key stakeholders. Visual presentations often communicate benchmarking results more effectively than tables of numbers.
Remember that benchmark data represents averages, which means some businesses perform above average and others below. Being below average in one metric doesn't necessarily indicate a problem if you're strong in other areas.
Look for patterns across multiple metrics rather than focusing on individual ratios in isolation. A complete picture of your performance requires considering how different metrics relate to each other and to your overall business strategy.
Consider the timing and economic context of benchmark data. Industry averages from a recession year might not be relevant comparisons during periods of economic growth.
Investigate significant variances from benchmark data to understand whether they represent problems, opportunities, or simply differences in business model or strategy.
Identify the specific operational changes needed to close performance gaps revealed by benchmarking analysis. This might involve process improvements, strategic changes, or resource reallocation decisions.
Set realistic but challenging targets based on benchmark data. If industry leaders achieve certain performance levels, those become reasonable goals for your business over time.
Track progress toward benchmark targets over time to measure the effectiveness of improvement initiatives. Regular monitoring helps ensure that changes are actually producing desired results.
Use benchmarking results to support strategic planning and resource allocation decisions. Performance gaps can help prioritize where to invest time and money for maximum impact.
One of the biggest mistakes small businesses make is comparing themselves to companies that aren't really comparable. A local service business shouldn't benchmark against national corporations or businesses in different market segments.
Size matters significantly in financial benchmarking. Large companies often achieve economies of scale that aren't available to smaller businesses, making direct comparisons misleading.
Geographic differences can also affect benchmark validity. Businesses in high-cost urban areas might have different cost structures than those in rural markets, requiring adjusted comparisons.
Business model differences within the same industry can create misleading comparisons. A high-end boutique retailer operates very differently from a discount retailer, even though they're in the same industry.
Not all financial ratios are equally important for every business. Service companies don't need to focus heavily on inventory turnover, while manufacturing businesses might not need to emphasize metrics relevant to asset-light business models.
Some business owners get caught up in vanity metrics that look impressive but don't actually drive business success. Revenue growth might seem important, but profitability and cash flow often matter more for long-term sustainability.
Short-term fluctuations in financial ratios can be misleading without proper context. Seasonal businesses need to compare performance during similar periods rather than looking at annual averages.
Industry-specific metrics often provide more valuable insights than generic financial ratios. Understanding what drives success in your particular industry helps focus benchmarking efforts appropriately.
Benchmarking reveals not just where you stand, but also what's possible in your industry. Companies achieving superior performance often have operational practices or strategies that others can learn from and adapt.
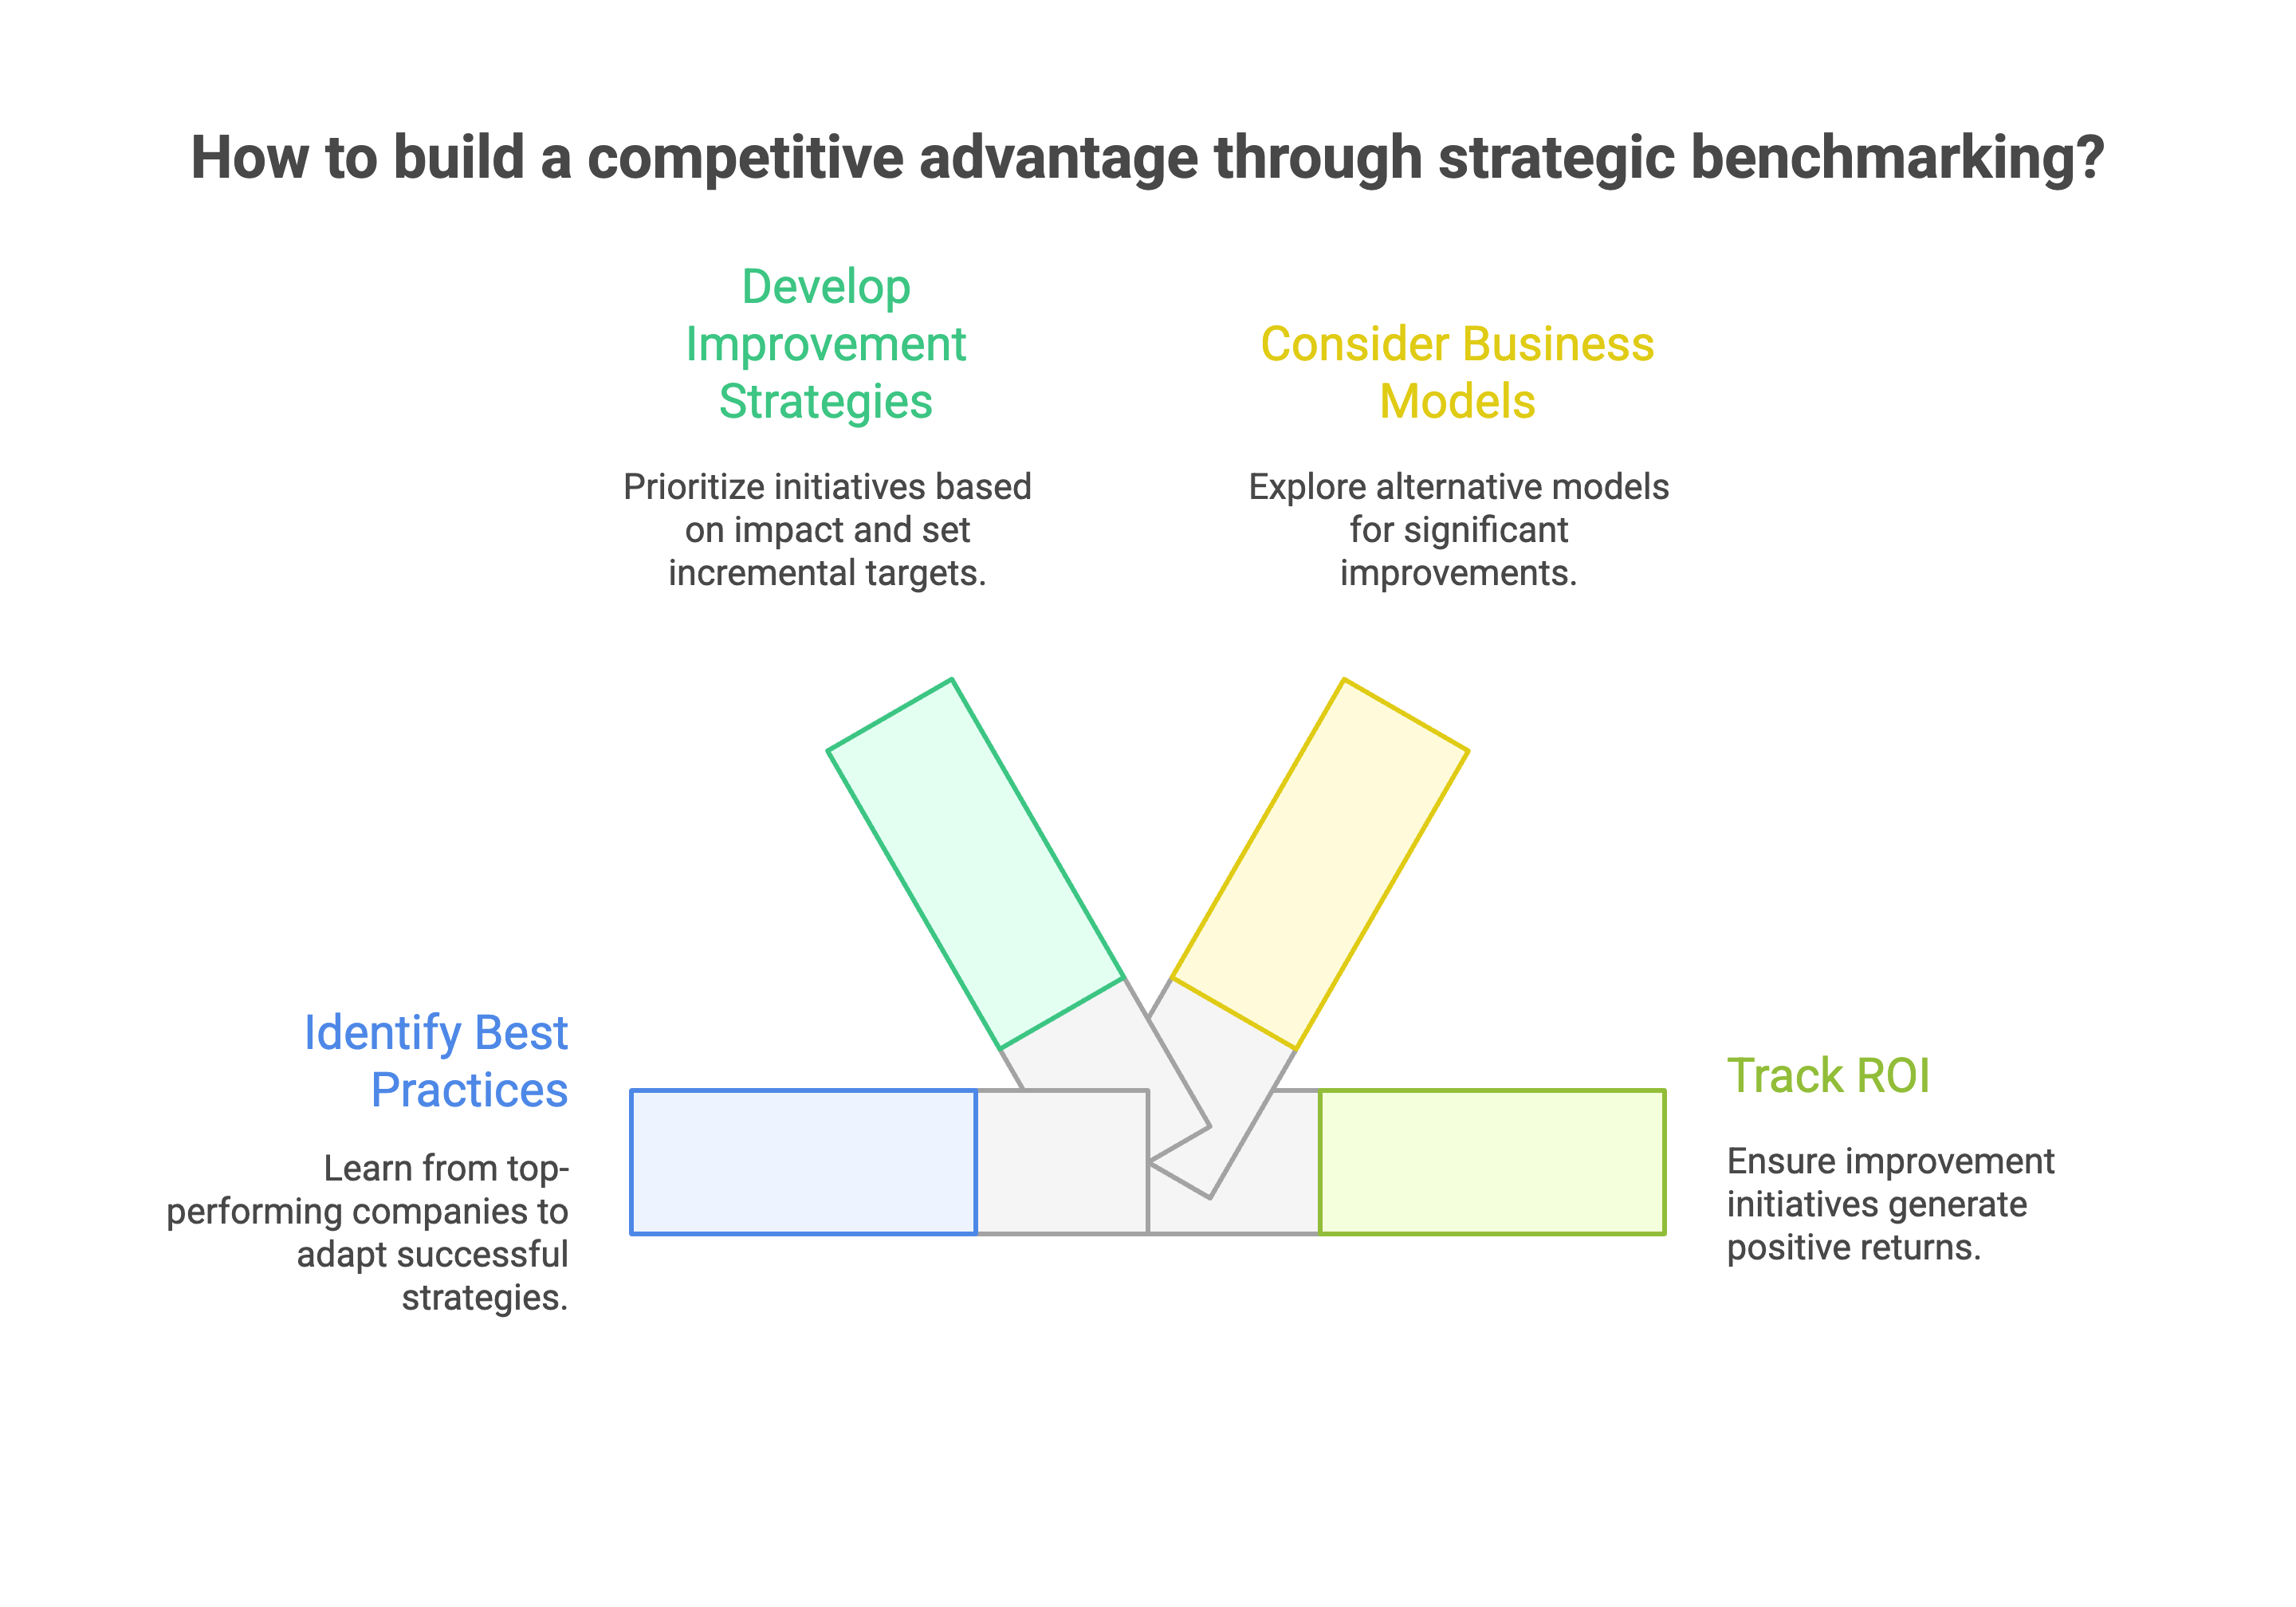
Look for businesses that consistently outperform industry averages across multiple metrics. These companies likely have systematic advantages that you can study and potentially replicate.
Industry conferences, trade publications, and case studies often highlight best practices from top-performing companies. This qualitative information complements quantitative benchmark data.
Consider reaching out to non-competing businesses in your industry to learn about their successful practices. Many business owners are willing to share insights, especially if you can offer reciprocal learning opportunities.
Use benchmark gaps to prioritize improvement initiatives based on their potential impact on overall business performance. Focus on changes that will have the greatest effect on key success metrics.
Set incremental targets that move you toward industry-leading performance over time. Trying to achieve top-quartile performance immediately might not be realistic, but steady improvement toward that goal is achievable.
Consider whether benchmark leaders are using different business models or strategies that you could adapt to your situation. Sometimes the biggest improvements come from rethinking fundamental approaches rather than just optimizing existing processes.
Track the cost and effort required to achieve benchmark improvements to ensure that your improvement initiatives generate positive returns on investment.
Q: How often should small businesses conduct financial benchmarking? A: Most small businesses benefit from annual benchmarking aligned with their financial year-end, with quarterly check-ins on key metrics. The frequency depends on how quickly your industry changes and how actively you're working to improve performance based on benchmark insights.
Q: What are the most important financial ratios for small business benchmarking? A: Core ratios include gross and net profit margins, current ratio, debt-to-equity ratio, inventory turnover, and revenue per employee. However, the most important ratios vary by industry and business model, so focus on metrics that most directly impact your success.
Q: Where can small businesses find reliable benchmark data for their industry? A: Good sources include industry trade associations, RMA Annual Statement Studies, government databases like the Economic Census, commercial benchmarking services, and some accounting software platforms that offer built-in benchmarking features.
Q: How do you benchmark against competitors when their financial data isn't public? A: Focus on industry average data from reliable sources rather than specific competitor information. You can also gather competitive intelligence through industry reports, trade publications, and networking with other business owners in non-competing markets.
Q: What should small businesses do if they're performing below industry benchmarks? A: First, verify that you're comparing against appropriate peer groups. Then investigate the root causes of performance gaps and develop specific action plans to address them. Focus on the metrics that have the biggest impact on your business success.
Q: Can benchmarking help with business valuation and sale preparation? A: Yes, benchmarking demonstrates how your business compares to industry standards, which is valuable information for potential buyers or investors. Strong performance relative to benchmarks can support higher valuations, while weak performance highlights areas that need improvement before a sale.
Q: How do seasonal businesses handle financial benchmarking effectively? A: Compare performance during similar seasonal periods rather than using annual averages. Many industries publish seasonal benchmark data, or you can calculate rolling 12-month averages to smooth out seasonal fluctuations while maintaining comparability.
Q: What's the difference between financial benchmarking and competitive analysis? A: Financial benchmarking compares your financial performance against industry standards or similar businesses using quantitative metrics. Competitive analysis is broader and includes market positioning, pricing strategies, customer service, and other qualitative factors that affect competitive advantage.
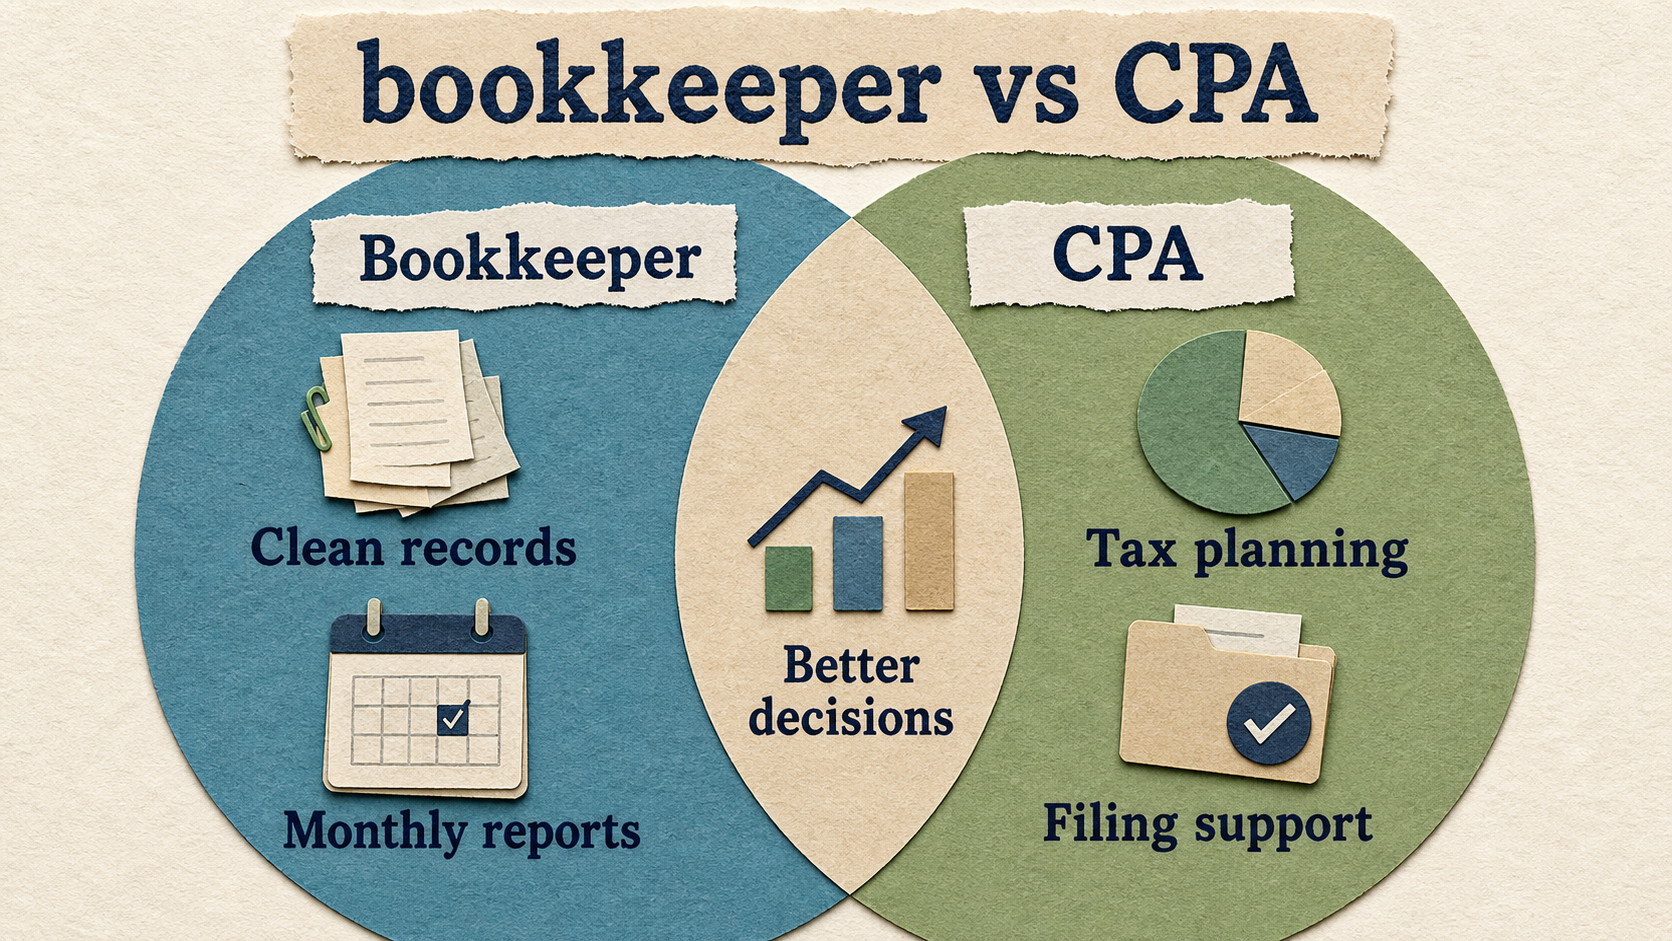
Compare a bookkeeper and CPA so your business knows when it needs recordkeeping, tax filing, planning, or higher-level advice.
Learn when to outsource bookkeeping, what tasks to hand off first, and how outsourced bookkeeping supports tax planning and decisions.
Use this ecommerce sales tax checklist to review nexus, registrations, marketplaces, product taxability, filings, and bookkeeping records.