


Physicians went to medical school to treat patients, not to analyze payer mix reports. Practice managers handle day-to-day operations but rarely have the financial training to model a new service line, evaluate the economics of adding a provider, or negotiate favorable terms on a practice acquisition.
This creates a gap. The practice generates $3M, $10M, or $25M in revenue but nobody is looking at the finances the way a CFO would. Nobody is asking whether the $180 average reimbursement for a specific procedure actually covers the fully loaded cost of delivering it. Nobody is modeling whether the new provider will be cash-flow positive in month 8 or month 18. Nobody is calculating the real return on that $500,000 equipment investment.
The practice manager might be excellent at scheduling, staff management, and keeping the office running. But practice managers typically come from a clinical or administrative background, not a finance background. They can tell you that overhead is "high" but they cannot tell you which overhead categories are out of line with benchmarks, or how a 3 percent reduction in supply costs translates to bottom-line improvement across a multi-location group.
A fractional CFO fills this gap. Not with generic financial advice, but with healthcare-specific financial leadership that understands how revenue cycle, payer mix, and regulatory compliance interact with practice economics. For the broader fractional CFO model, our complete guide covers the fundamentals. This article is specifically about healthcare.
Most practices treat revenue cycle management (RCM) as a billing department function. It is not. It is a finance function with operational implications.
The revenue cycle starts when a patient schedules an appointment and ends when the last dollar of reimbursement is collected. In between, there are eligibility verification, coding, charge capture, claim submission, denial management, payment posting, patient balance follow-up, and aging analysis. Each step has a financial impact, and weak performance at any step leaks revenue.
A fractional CFO looks at the revenue cycle as a financial system, not a billing workflow. The key metrics they track include days in AR (target: under 35 for commercial payers, under 45 for government), clean claim rate (target: above 95 percent), denial rate (target: below 5 percent), collection rate (target: above 95 percent of expected reimbursement), and cost to collect (target: 4 to 6 percent of net revenue).
When these metrics are off, the fractional CFO traces the root cause. High days in AR might mean slow claim submission, high denial rates, or poor patient balance follow-up. A high denial rate might mean coding errors, missing authorizations, or eligibility failures. Each root cause has a different fix, and the financial impact of fixing it is quantifiable.
In our experience, the most common revenue cycle leak is denial management. Practices submit claims, receive denials, and never rework them. The billing staff is busy with new claims and the denials pile up in a "to do" queue that never gets done. A fractional CFO quantifies the dollar value sitting in that queue and builds a process for systematic rework. We typically see denial rework recover 40 to 60 percent of the denied amount, which for a practice with a 10 percent denial rate on $5M in charges, represents $200,000 to $300,000 in recoverable revenue.
We have seen fractional CFO engagements improve practice collections by 8 to 15 percent simply by identifying and addressing revenue cycle leaks that had been tolerated for years. On a $5M practice, that is $400,000 to $750,000 in additional annual revenue without seeing a single additional patient. Our medical practice accounting guide covers the accounting side of this equation.
Not all revenue is created equal. A practice that collects $180 per visit from a commercial payer and $95 per visit from Medicaid has very different economics depending on the mix.
A fractional CFO builds a payer mix dashboard that shows revenue by payer, reimbursement rates by CPT code by payer, cost per visit by payer (factoring in administrative burden and denial rates), and net margin by payer. This analysis often reveals that a practice is losing money on certain payers while subsidizing the loss with higher-reimbursement payers.
Armed with this data, the fractional CFO supports payer contract negotiations. Most practices accept the payer's proposed rates without analysis. A CFO who can demonstrate that the practice's cost to deliver a service exceeds the payer's reimbursement creates a factual basis for rate negotiation. We have seen practices negotiate 8 to 20 percent rate increases on specific CPT codes when they can present the cost data convincingly.
The negotiation process itself is something most practice owners find intimidating. They assume payer rates are non-negotiable. In our experience, that is only true for Medicare and Medicaid, where rates are set by the government. Commercial payers negotiate. The key is approaching the conversation with data, not complaints. A presentation that says "our cost to deliver CPT 99213 is $142 and your reimbursement is $118, creating a $24 per visit loss that we absorb 3,000 times per year" is far more compelling than "we need higher rates."
The fractional CFO also evaluates whether certain payers should be dropped entirely. If a practice loses $50,000 per year on a specific Medicaid managed care plan after accounting for administrative costs and denial rates, and replacing those patient slots with commercial payer patients is feasible, the financial case for dropping that plan is clear. These are difficult decisions with community impact implications, and the CFO provides the financial analysis while the physician makes the final call.
Healthcare practices have specific overhead benchmarks that vary by specialty. A general practice should target total overhead at 60 to 65 percent of collections. Dental practices typically run 55 to 62 percent. Specialty surgical practices might run lower because of higher per-procedure reimbursement. Knowing where your practice stands relative to these benchmarks is the first step in cost management.
A fractional CFO breaks overhead into its components and compares each to industry benchmarks. Staff costs (the largest expense for most practices at 25 to 30 percent of collections), facility costs (5 to 8 percent), supplies (5 to 8 percent depending on specialty), lab costs (varies widely by specialty), and technology costs (2 to 4 percent). When a category is above benchmark, the CFO digs into why and develops a plan to bring it in line.
We typically see the biggest savings opportunities in staffing efficiency and supply costs. Staffing efficiency is about matching staff levels to patient volume. A practice that staffs for peak volume all day is overstaffed during slow hours. A fractional CFO analyzes patient volume by hour and day of week, then works with the practice manager to build a staffing model that flexes with demand. The savings from right-sizing staffing schedules can run 5 to 10 percent of total staff costs without reducing patient care quality.
Supply costs offer another area where data-driven management makes a difference. Most practices order supplies based on habit rather than cost analysis. A fractional CFO evaluates vendor contracts, compares pricing across suppliers, identifies opportunities for group purchasing (especially for multi-location practices), and tracks supply cost per procedure to identify waste. In our experience, a systematic supply cost review saves 8 to 15 percent on materials and supplies for the typical practice.
For multi-provider practices, one of the most important financial analyses is profitability by provider. Is Dr. Smith generating enough revenue to cover their compensation, their share of overhead, and a reasonable margin for the practice? Or are the other providers subsidizing Dr. Smith's lower productivity?
A fractional CFO models provider compensation against production (collections or wRVUs), overhead allocation, and benefit costs. The analysis considers not just compensation amount but compensation structure: salary, productivity bonus, quality bonus, partnership track, and benefit package.
The wRVU (work relative value unit) analysis deserves special attention. wRVUs measure the relative effort of each procedure, and comparing provider wRVU production against compensation reveals whether each provider is compensated fairly relative to their work. MGMA (Medical Group Management Association) publishes annual compensation benchmarks by specialty and by wRVU production level. A fractional CFO uses these benchmarks to evaluate whether provider compensation is competitive (important for retention) and whether it aligns with production (important for practice profitability).
For practices evaluating whether to add a new provider, the fractional CFO models the ramp-up period (typically 12 to 24 months for a new physician to reach full productivity), the working capital needed to carry the provider during ramp-up, and the break-even timeline. This prevents the common mistake of hiring a new provider based on demand without understanding the financial impact during the slow ramp-up months.
We have modeled provider additions for practices across multiple specialties, and the pattern is consistent. Months 1 through 6 are negative cash flow as the new provider builds a patient panel. Months 7 through 12 approach break-even. Months 13 through 24 should reach full productivity. If the model shows break-even beyond month 18, the practice needs to evaluate whether the market can support the additional capacity or whether the ramp-up assumptions are too optimistic.
Healthcare practices grow through four paths: organic growth (seeing more patients per provider), adding providers, adding locations, and acquisitions. Each path has different financial requirements and return profiles.
A fractional CFO models each growth scenario with realistic assumptions. Adding a location means analyzing the market, projecting patient volume ramp-up, modeling the lease and build-out costs, and calculating the break-even timeline. Acquiring another practice means valuing the target (typically 3 to 7 times EBITDA or 50 to 100 percent of annual collections depending on specialty), negotiating terms, and planning the financial integration.
For practices considering a sale or partnership with a DSO (dental service organization) or MSO (management services organization), the fractional CFO prepares the practice for valuation by cleaning up financials, documenting revenue streams, and presenting the historical performance in the format that buyers expect. A well-prepared practice sells at a 20 to 40 percent premium over one with messy financials.
The preparation process typically takes 12 to 18 months. In the first phase, the fractional CFO cleans up the chart of accounts, normalizes owner compensation and perks, and produces trailing 12-month adjusted EBITDA. In the second phase, they document the revenue by payer, provider production metrics, and overhead benchmarks in the format that DSO and MSO buyers expect. In the third phase, they work with the practice's M&A advisor to present the financial story to potential buyers.
We have supported practices through this preparation process and the impact on valuation is significant. A dental practice that presented clean financials with clear provider production data, documented payer mix analysis, and normalized EBITDA received a valuation 35 percent higher than the initial estimate based on their messy, pre-cleanup books.
Healthcare practices face unique cash flow challenges that general CFO advice does not address. Insurance reimbursement cycles create a 30 to 90 day lag between service delivery and payment. Patient responsibility balances are increasingly difficult to collect as high-deductible health plans become more common. And capital equipment purchases (imaging equipment, dental chairs, surgical instruments) require significant upfront investment with long payback periods.
A fractional CFO builds a rolling 13-week cash flow forecast that accounts for the reimbursement lag, patient payment patterns, payroll cycles, and equipment financing. This forecast allows the practice to anticipate cash shortfalls and arrange financing before they become emergencies. In our experience, the 13-week cash flow forecast is one of the first deliverables a practice owner asks for because it eliminates the anxiety of not knowing whether payroll will be covered next month.
Working capital management is equally important. A practice that collects patient co-pays at the time of service has better cash flow than one that bills co-pays after the visit. A practice that verifies insurance eligibility before the appointment has fewer denials and faster collections than one that checks eligibility after the fact. These are operational changes, but the fractional CFO identifies them through financial analysis and quantifies the impact to build the case for change.
Our model pairs a fractional CFO who understands healthcare finance with an offshore production team that handles the analytical work. The CFO attends weekly or biweekly meetings with practice leadership, reviews KPIs, and drives strategic decisions. The Chennai team builds the financial models, maintains the dashboards, processes the monthly close, and prepares the reports.
This hybrid model keeps costs manageable for practices that need CFO-level insight but cannot justify a full-time CFO salary of $200,000 to $300,000. The fractional CFO provides 15 to 25 hours per month of strategic time, while the offshore team provides 40 to 80 hours per month of production time. The combined cost is a fraction of a full-time hire, but the output is comparable because the production work is being handled efficiently by a dedicated team.
Pricing for healthcare fractional CFO engagements typically runs $4,000 to $6,000 per month for single-location practices with $3M to $10M revenue, $6,000 to $9,000 for multi-location practices or groups with $10M to $30M revenue, and $9,000 to $12,000 for larger systems or complex situations involving acquisitions or DSO transactions.
If you are a CPA firm serving healthcare practices and want to offer fractional CFO services without building an in-house healthcare finance team, or if you are a practice looking for financial leadership, reach out at madrasaccountancy.com.
Our financial reporting and analysis does not involve accessing protected health information (PHI). We work with de-identified financial data: revenue by payer, collections by CPT code, overhead allocations, and production metrics. The practice's EHR and billing system access stays within the practice. Our work is on the financial analysis side, not the clinical data side.
Yes. DSO and MSO transactions are a core use case. We prepare the practice's financials for buyer due diligence, model different deal structures (full sale, partnership, management agreement), and provide financial analysis during negotiations. For dental practices specifically, we have supported multiple DSO transactions from initial valuation through closing.
Our financial analysis integrates with data exported from major practice management systems including Athenahealth, eClinicalWorks, NextGen, Dentrix, Eaglesoft, and Open Dental. We do not access the systems directly. The practice exports the financial data, and our team builds the analysis from those exports.
Generally at $3M or more in annual collections, or when you are actively considering a major financial decision (adding a provider, opening a second location, or evaluating a sale). Below $3M, a CPA with advisory capabilities may be sufficient. Above $3M, the financial complexity typically justifies dedicated CFO attention.
In our experience, the first meaningful insights come within 60 to 90 days. The initial assessment identifies the largest revenue cycle leaks and overhead issues. Quick wins (denial rework, fee schedule updates, staffing adjustments) produce measurable results within 90 to 120 days. Longer-term initiatives like payer contract renegotiation and growth planning take 6 to 12 months to fully execute but the financial modeling that supports them starts immediately.
Absolutely. The fractional CFO and the practice manager serve different functions. The practice manager handles operational execution: scheduling, staffing, vendor management, patient flow. The fractional CFO handles financial strategy: revenue cycle optimization, payer analysis, provider compensation modeling, growth planning, and cash flow forecasting. In the best engagements, the two work closely together, with the CFO providing the financial insight that guides the practice manager's operational decisions.
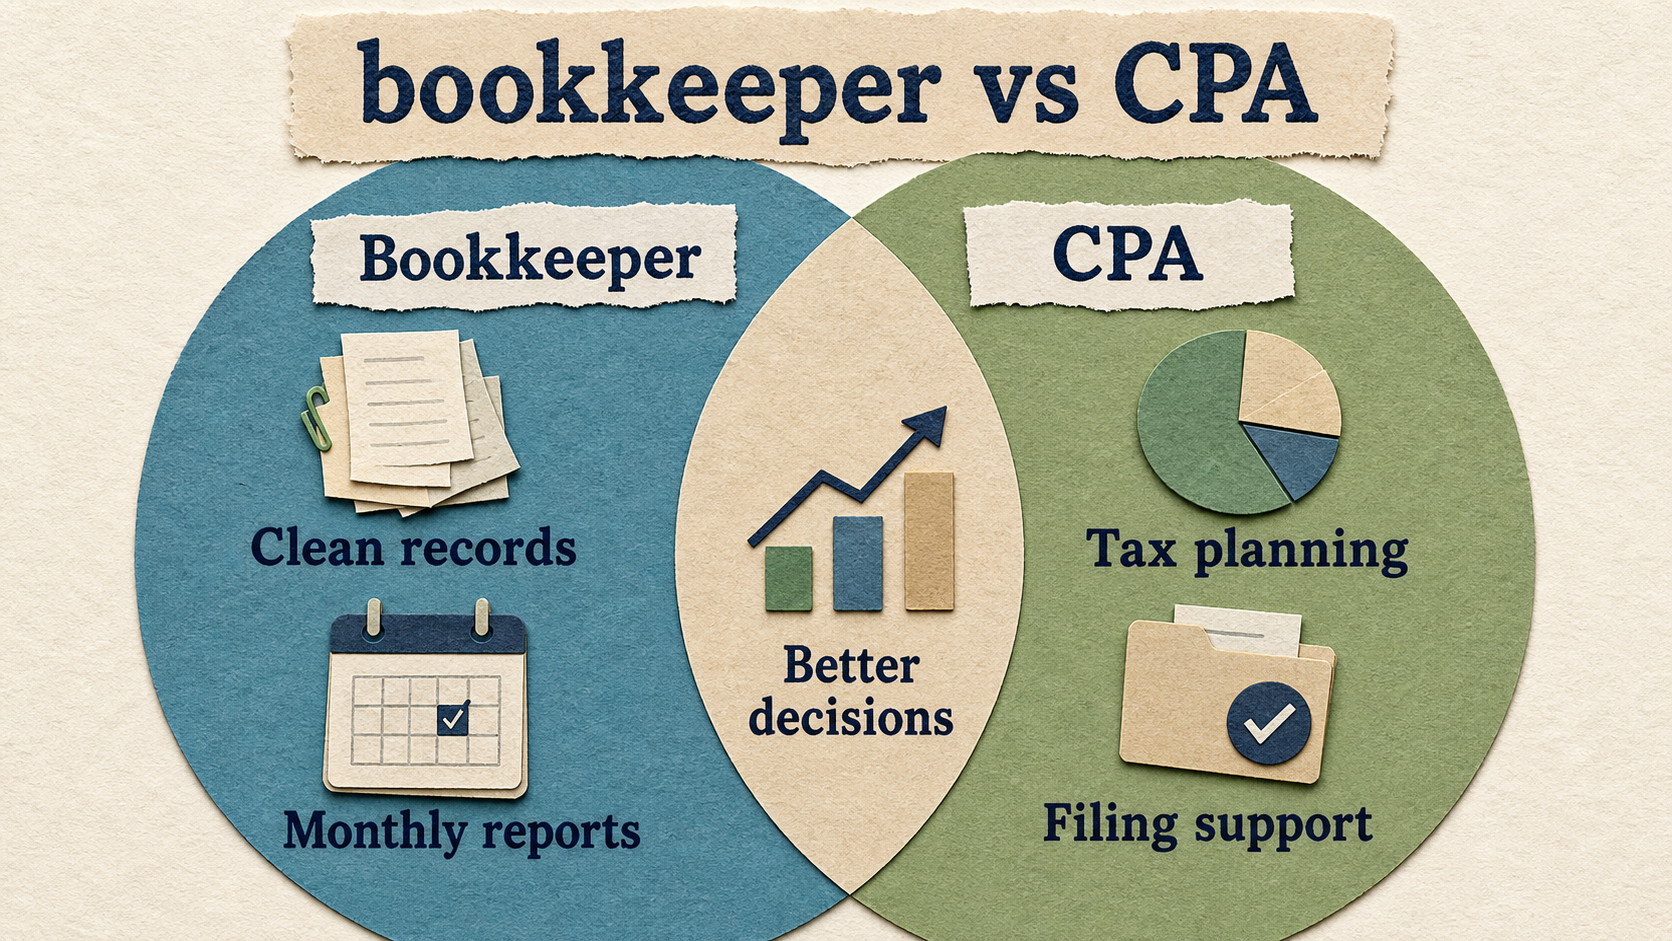
Compare a bookkeeper and CPA so your business knows when it needs recordkeeping, tax filing, planning, or higher-level advice.

Learn when to outsource bookkeeping, what tasks to hand off first, and how outsourced bookkeeping supports tax planning and decisions.

Use this ecommerce sales tax checklist to review nexus, registrations, marketplaces, product taxability, filings, and bookkeeping records.