
Meta Description: Master real estate pro formas: Project NOI, cash flow & ROI accurately. Proven templates & examples from 50,000+ financial models. Essential for investors & CPAs.
A real estate pro forma model is a financial projection that forecasts a property's income, operating expenses, and cash flow over a defined holding period. It calculates net operating income by starting with potential gross income, subtracting vacancy losses and expenses, then factors in debt service to determine cash flow available to investors. This model serves as the primary tool for evaluating whether a property investment meets return requirements.
Picture this: you're reviewing a multifamily property listed at $2.8 million. The seller claims it generates $320,000 annually. Without a pro forma, you're essentially buying blind.
Most commercial real estate investors lose money not because they picked bad properties, but because they relied on inaccurate financial projections. A real estate pro forma transforms assumptions into actionable numbers, revealing whether a property will generate the returns you need.
This guide walks you through building, analyzing, and stress-testing real estate pro formas. You'll learn the exact line items institutional investors use, common seller tricks to watch for, and how to structure projections that hold up under lender scrutiny.
A real estate pro forma is a multi-period cash flow projection that models every dollar flowing in and out of a property investment. Think of it as your property's financial story told in spreadsheet form.
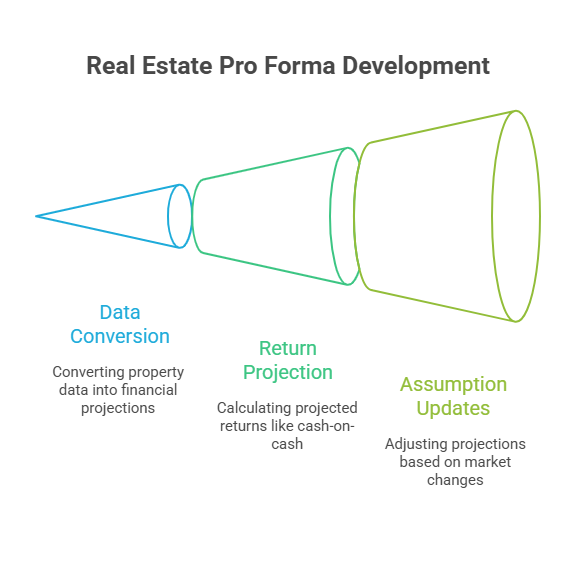
The term "pro forma" derives from Latin meaning "as a matter of form." In practice, it's the document that converts property characteristics, unit count, square footage, market rent, expense ratios, into projected returns like cash-on-cash and internal rate of return.
Unlike historical financial statements that report what happened, a pro forma projects what should happen based on your assumptions. Most real estate pro formas span 5-10 years and update quarterly as market conditions shift.
Properties are simpler than operating companies. You don't need a full balance sheet, income statement, and cash flow statement because:
The pro forma captures 95% of what matters for investment decisions in one streamlined schedule.
Every effective pro forma follows the same logical flow, moving from theoretical maximum income down to actual cash available for distribution.
Potential Gross Income represents the revenue a property would generate at 100% occupancy with all tenants paying market rates. This is your theoretical maximum.
For a 50-unit apartment building where market rent is $1,500/month:
Commercial properties calculate this differently. An office building with 100,000 rentable square feet at $28 per square foot generates $2.8 million in potential gross income. Retail centers might add percentage rent clauses where tenants pay base rent plus a percentage of sales above certain thresholds.
Properties are rarely fully occupied. Vacancy accounts for empty units, while credit loss covers tenants who don't pay.
Most pro formas express these as percentages of potential gross income:
The calculation works like this:
Two types of vacancy deserve separate line items in sophisticated models. Turnover vacancy occurs between tenant departures and new lease signings, typically 30-60 days for residential, 6-12 months for commercial. General vacancy maintains a cushion for units that stay empty longer than expected or market softness.
Effective gross income isn't just rent. Additional revenue streams include:
A 200-unit apartment community might generate $40,000-60,000 annually from these sources, enough to meaningfully impact returns.
Operating expenses cover everything required to maintain and run the property. These fall into controllable and uncontrollable categories.
Controllable expenses:
Uncontrollable expenses:
Most operators benchmark expenses on a per-square-foot basis. Well-run office properties run $6-12 per square foot annually. Multifamily typically falls between $3,500-5,500 per unit depending on age and amenities.
When creating detailed financial projections, expense accuracy matters more than revenue optimism. A 10% underestimate on expenses destroys returns faster than overestimating rent.
Net Operating Income (NOI) is the single most important metric in real estate. It represents cash generated from property operations before debt service and capital expenditures.
Calculation: Effective Gross Income + Other Income - Operating Expenses = Net Operating Income
Using our 50-unit example:
Buyers use NOI to determine property value through cap rates. If similar properties trade at 6% cap rates, this property is worth approximately $8.3 million ($500,000 ÷ 0.06).
Lenders use NOI to assess debt capacity. With a required 1.25x debt service coverage ratio, this property supports roughly $2.4 million in debt at 6% interest on a 25-year amortization.
Below NOI, three major capital items affect cash flow but aren't classified as operating expenses.
CapEx covers major system replacements and building improvements that extend useful life. Think roofs, HVAC systems, parking lot resurfacing, and elevator modernization.
Most pro formas budget CapEx at $200-500 per unit annually for multifamily or $0.50-1.50 per square foot for commercial. These funds accumulate in reserves since actual expenditures are lumpy, you don't replace a roof every year, but when you do, it costs $150,000-300,000.
Age and condition drive CapEx budgeting. A 40-year-old property with original systems needs $800+ per unit reserves. A 5-year-old building might only require $150-250 per unit.
Tenant improvements are build-outs customized for specific tenants. Office leases commonly include TI allowances of $20-60 per square foot for new tenants. Retail might be $40-100+ per square foot depending on space condition and tenant requirements.
For a 5,000-square-foot office space with a $35 per square foot TI allowance, the landlord invests $175,000 to prepare the space. These costs are amortized mentally over the lease term when evaluating return.
When new tenants sign leases, brokers earn commissions, typically 4-6% of total lease value split between listing and tenant brokers.
On a 5-year office lease at $30 per square foot for 10,000 square feet:
These transaction costs directly reduce cash flow in years where significant leasing activity occurs.
Nearly all commercial real estate acquisitions use leverage. Debt service consumes a large portion of NOI.
Interest is calculated as: Interest Rate × Outstanding Principal Balance
A $5 million loan at 6% interest costs $300,000 in year one. As principal pays down, interest expense decreases slightly each year with amortizing loans.
Principal payments rebuild equity and reduce debt, but they're not tax-deductible. A 25-year amortization on that $5 million loan requires roughly $80,000 in principal payments year one, increasing annually.
Total debt service (interest + principal) = $380,000 in year one.
This is the bottom line, cash that flows to equity investors after all obligations.
Calculation: NOI - CapEx - Debt Service = Cash Flow to Equity
From our example:
If you invested $3 million in equity, your year-one cash-on-cash return is 3.6% ($107,500 ÷ $3,000,000). Not exciting yet, but as rents grow and debt pays down, returns improve substantially by year 5-7.
Creating an accurate pro forma requires methodical data gathering and conservative assumptions.
Before opening Excel, collect:
Real estate investors who understand how to analyze financial statements catch red flags faster, like mysteriously low property taxes that will reset post-sale or deferred maintenance masked by minimal CapEx spending.
Start conservative, then create upside cases:
Base case:
Upside case:
Use a blended approach:
Common seller tricks include:
Determine optimal debt levels:
Higher leverage amplifies returns when properties appreciate but magnifies losses in downturns.
Once cash flows are projected, compute:
Cash-on-cash return: Year 1 cash flow ÷ Equity invested
Internal rate of return (IRR): Time-weighted return accounting for all cash flows and exit proceeds. Most institutional investors target 15-20% IRR for value-add deals, 10-12% for core properties.
Equity multiple: Total cash returned ÷ Equity invested over the hold period. A 2.0x multiple means you doubled your money.
Cap rate at sale: Projected exit NOI ÷ Expected sale price. Most pro formas assume stable or slightly higher cap rates at exit (conservative approach).
Even experienced investors make these mistakes.
Projecting 5-7% annual rent growth assumes markets will stay hot forever. Historical data shows long-term rent growth tracks inflation at 2-3% annually.
Solution: Use conservative 2.5% base growth, create separate upside cases for specific improvements.
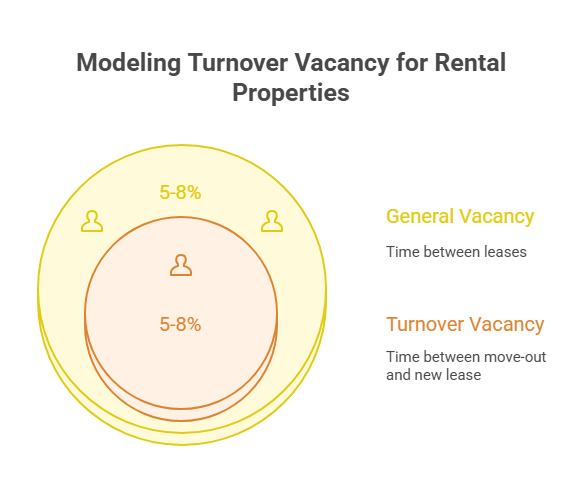
Tenants don't renew instantly. Each turnover costs 1-2 months of rent plus turn costs (painting, cleaning, minor repairs).
Solution: Model turnover vacancy separately at 5-8% on top of general vacancy for the time between move-out and new lease signing.
Some sellers present pro formas without CapEx, showing inflated cash flow. Those roof leaks and aging HVAC systems will demand payment.
Solution: Always budget minimum $250-500 per unit annually. Get a property condition assessment from a qualified inspector before acquisition.
Sellers optimize their pro formas to maximize sale price. They're not lying, they're highlighting best-case scenarios.
Solution: Build your own pro forma from scratch using verified data. Request T-12 financials (trailing 12-month operating statements) and rent rolls showing actual in-place leases with lease terms and renewal dates.
Real estate markets cycle every 7-10 years. Projecting 2024-2025 rent growth rates for 10 years straight ignores economic reality.
Solution: Model at least one recessionary year with flat or negative rent growth, elevated vacancy, and possibly reduced NOI.
Once you master basic pro formas, these refinements separate amateur from institutional-quality analysis.
Instead of treating all rental income as one number, model each lease separately with:
This granularity reveals concentration risk. If 40% of NOI comes from one tenant expiring in year three, that's a major risk factor.
Create data tables showing how returns change when key assumptions flex:
Sophisticated investors run Monte Carlo simulations with thousands of scenarios to understand probability distributions of outcomes.
Value-add properties require more complex pro formas with renovation timelines:
These properties don't generate much cash flow initially but deliver strong IRRs if execution goes well. The pro forma must accurately model the J-curve where early years show negative cash flow before stabilization drives returns.
Many firms engage fractional CFO services for sophisticated financial modeling when their in-house teams lack commercial real estate expertise. Having someone who's built 500+ pro formas review your assumptions before you deploy $5 million in equity isn't expensive, it's essential.
Let's walk through a complete example with realistic numbers.
Property: 100-unit garden-style apartments, suburban market
Purchase Price: $12,000,000 ($120,000/unit)
Loan: $8,400,000 (70% LTV, 6% interest, 25-year amortization)
Equity: $3,600,000
Revenue:
Operating Expenses:
Net Operating Income: $1,007,800
Below NOI:
Return Metrics:
Over a 10-year hold with 2.5% annual rent growth, 7.5% exit cap rate, and accounting for debt paydown, this deal projects a 14.2% IRR and 1.92x equity multiple.
Understanding what capital partners look for helps you build credible projections.
Banks and agency lenders (Fannie Mae, Freddie Mac) care primarily about:
Debt service coverage ratio (DSCR): They want to see 1.25-1.30x minimum to ensure NOI comfortably covers debt payments even if performance dips.
Loan-to-value (LTV): Most cap at 65-75% LTV on acquisitions, 80% on refinances.
Pro forma reasonableness: They'll stress-test your assumptions. If you project 5% rent growth when the market averages 2%, expect pushback and lower proceeds.
Vacancy assumptions: Most lenders require minimum 5% vacancy even if actuals are lower. They want cushion built in.
Lenders hire third-party appraisers who create independent pro formas. If your projections deviate significantly from the appraiser's, your loan amount decreases.
Whether you're raising money from friends and family or pitching institutional capital, investors scrutinize:
IRR hurdles: Core investors target 10-12% IRR, value-add seeks 15-18%, opportunistic demands 20%+.
Downside protection: What happens if things go wrong? Show sensitivity cases where key assumptions fail.
Track record: First-time operators must use ultra-conservative assumptions since they lack execution proof.
Exit strategy clarity: How and when will investors get liquidity? Refinance in year 3, sell in year 7? Be specific.
Operator alignment: Are you investing your own capital alongside theirs? Skin in the game matters.
When preparing financial projections for investor due diligence, presentation matters as much as content. Clean formatting, clear assumption documentation, and professional charts build confidence that you know what you're doing.
You don't need to build every pro forma from scratch.
Most real estate investors start with Excel. Free templates are available from:
Good templates include:
As deal volume grows, dedicated software saves time:
ARGUS Enterprise: Industry standard for office and retail with complex lease structures. Steep learning curve, $5,000+ annually.
CoStar Real Estate Manager: Integrates with CoStar's market data, strong for portfolio management.
RealData: Affordable option for smaller investors, good for residential and simple commercial.
Juniper Square: Popular in private equity real estate for investor reporting and portfolio tracking.
Consider outsourcing pro forma creation when:
A commercial real estate consultant charges $2,000-5,000 for a comprehensive pro forma on a typical deal. That's cheap insurance against a $500,000 mistake from bad assumptions.
What's the difference between a real estate pro forma and a budget?
A budget is a near-term operating plan, typically for the next 12 months, showing expected income and expenses. A pro forma is a multi-year financial projection (usually 5-10 years) that forecasts returns and cash flows for investment analysis. Budgets guide day-to-day operations; pro formas drive acquisition and financing decisions.
How do I account for property tax increases in my pro forma?
Property taxes typically increase 2-4% annually, but reassessments after sale can cause larger jumps. Many jurisdictions reassess at sale price, potentially increasing taxes 20-40% immediately. Always verify current assessed value, call the assessor's office to understand reassessment rules, and model post-sale tax levels. Conservative pro formas assume taxes increase to full market value after acquisition.
Should I include depreciation in my real estate pro forma?
No. Depreciation is a non-cash tax deduction that doesn't affect actual cash flow. Pro formas focus on cash in and cash out. Depreciation matters for tax planning and equity waterfall calculations, but it's handled separately from the core operating pro forma. If you're analyzing after-tax returns, create a separate tax schedule that flows into your equity returns.
What cap rate should I use for my exit assumption?
Use current market cap rates for similar stabilized properties, then add 25-50 basis points (0.25-0.50%) as a conservative buffer. Real estate markets can shift over 5-10 years. If Class A multifamily trades at 5.0% today, exit at 5.25-5.50% in your base case. Create downside scenarios with cap rates 100+ basis points higher to stress test returns.
How much vacancy should I model in my pro forma?
It depends on asset class and strategy. Stabilized multifamily: 5-8% total vacancy (combining economic and physical vacancy). Office: 8-12% for Class A, 15%+ for Class B/C. Retail: 10-15%. Value-add properties needing renovation: 15-25% during the first 18-24 months. Always model both general vacancy and turnover vacancy separately for precision.
What's the difference between effective gross income and net operating income?
Effective Gross Income (EGI) is total rental income after vacancy and credit loss, plus other income. Net Operating Income (NOI) is EGI minus all operating expenses. The formula: EGI - Operating Expenses = NOI. NOI is the critical metric because it shows property earnings before debt and capital expenditures, making it useful for valuation and comparing properties regardless of capital structure.
Can I use a residential real estate pro forma template for commercial properties?
Not effectively. Residential pro formas (single-family, small multifamily) are simpler with straightforward rent calculations. Commercial pro formas require lease-by-lease modeling with complex terms like free rent periods, tenant improvement allowances, expense recoveries, percentage rent clauses, and multi-year escalations. Use commercial-specific templates to avoid missing critical line items that affect returns.
How does Madras Accountancy help with real estate pro forma analysis?
Madras Accountancy provides offshore accounting support to U.S. CPA firms that serve real estate clients. We help accountants build and audit client pro formas, verify expense assumptions, model tax implications, and stress-test investment scenarios. Our team processes financial statements for 200+ accounting firms, giving us insight into what makes real estate deals succeed or fail. We don't invest directly but support the professionals who guide investor clients.
A real estate pro forma transforms assumptions into actionable intelligence. Master this tool, and you'll evaluate properties faster, negotiate smarter, and avoid deals that look good on the surface but collapse under scrutiny.
The difference between a 14% IRR and an 8% IRR often comes down to assumption accuracy in your pro forma. Model conservatively, verify every input, and stress-test your projections against downside scenarios.
Start with a simple template, validate it against actual property performance, then gradually add sophistication as your experience grows. Whether you're acquiring your first rental property or underwriting a $50 million portfolio, the principles remain constant: revenue minus expenses equals NOI, and cash flow determines value.
About Madras Accountancy
Madras Accountancy partners with U.S. CPA firms to deliver offshore accounting, tax preparation, and CFO services. Since 2015, we've supported over 200 accounting practices with high-quality financial analysis, helping their clients, including real estate investors, make data-driven decisions. Learn more at madrasaccountancy.com.
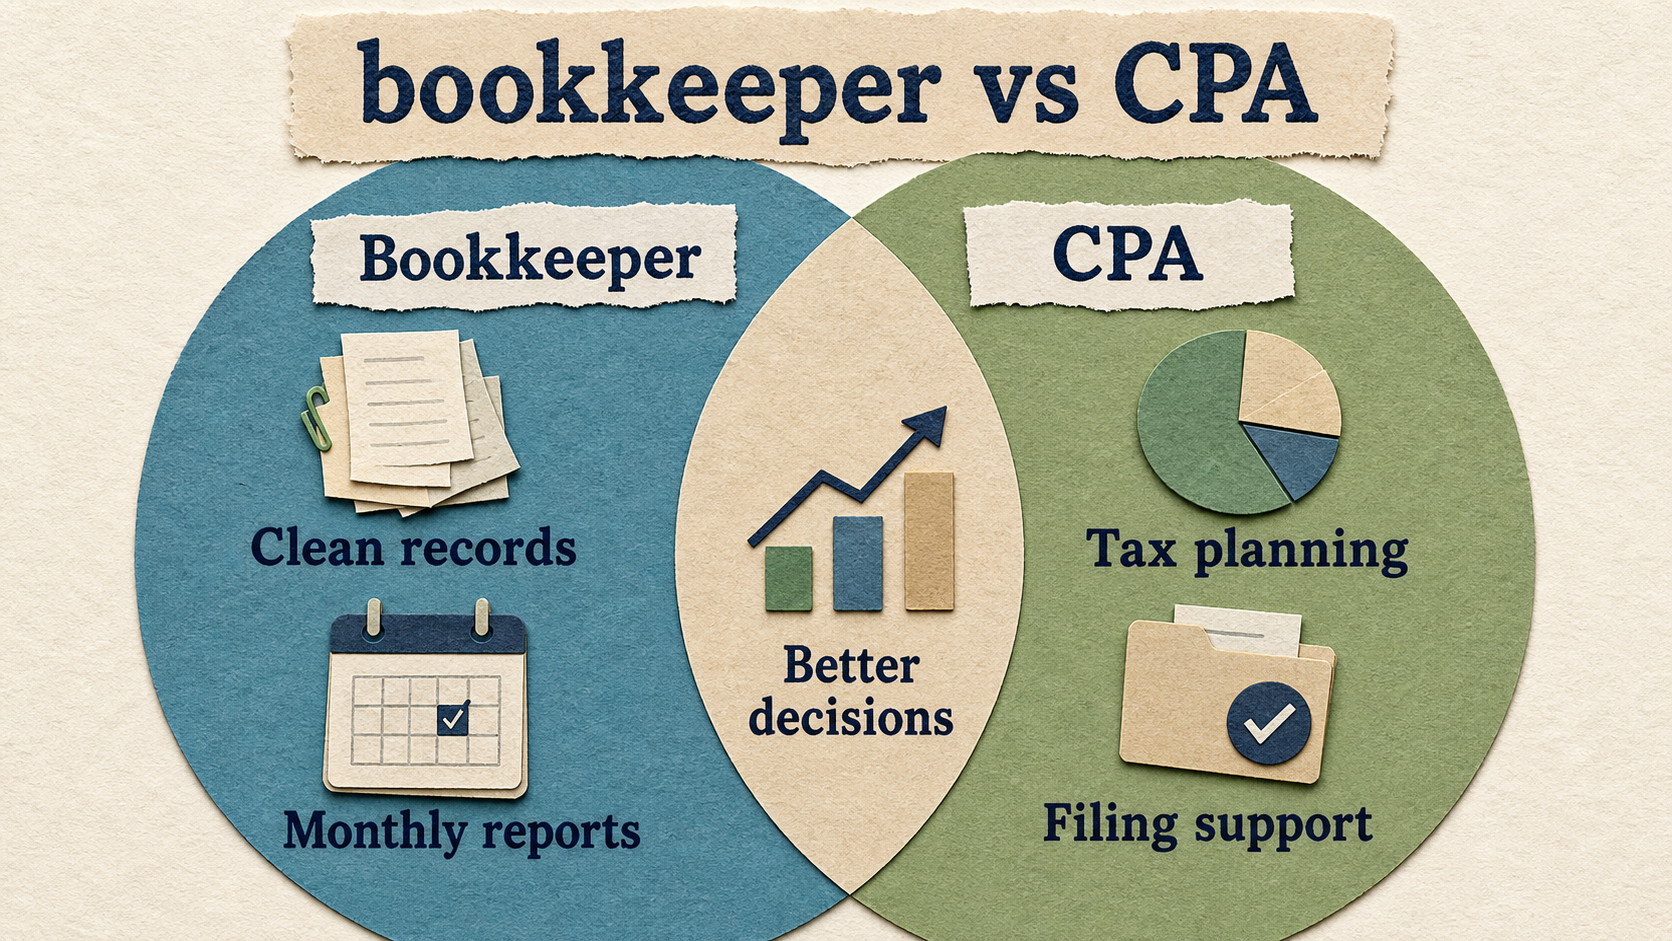
Compare a bookkeeper and CPA so your business knows when it needs recordkeeping, tax filing, planning, or higher-level advice.
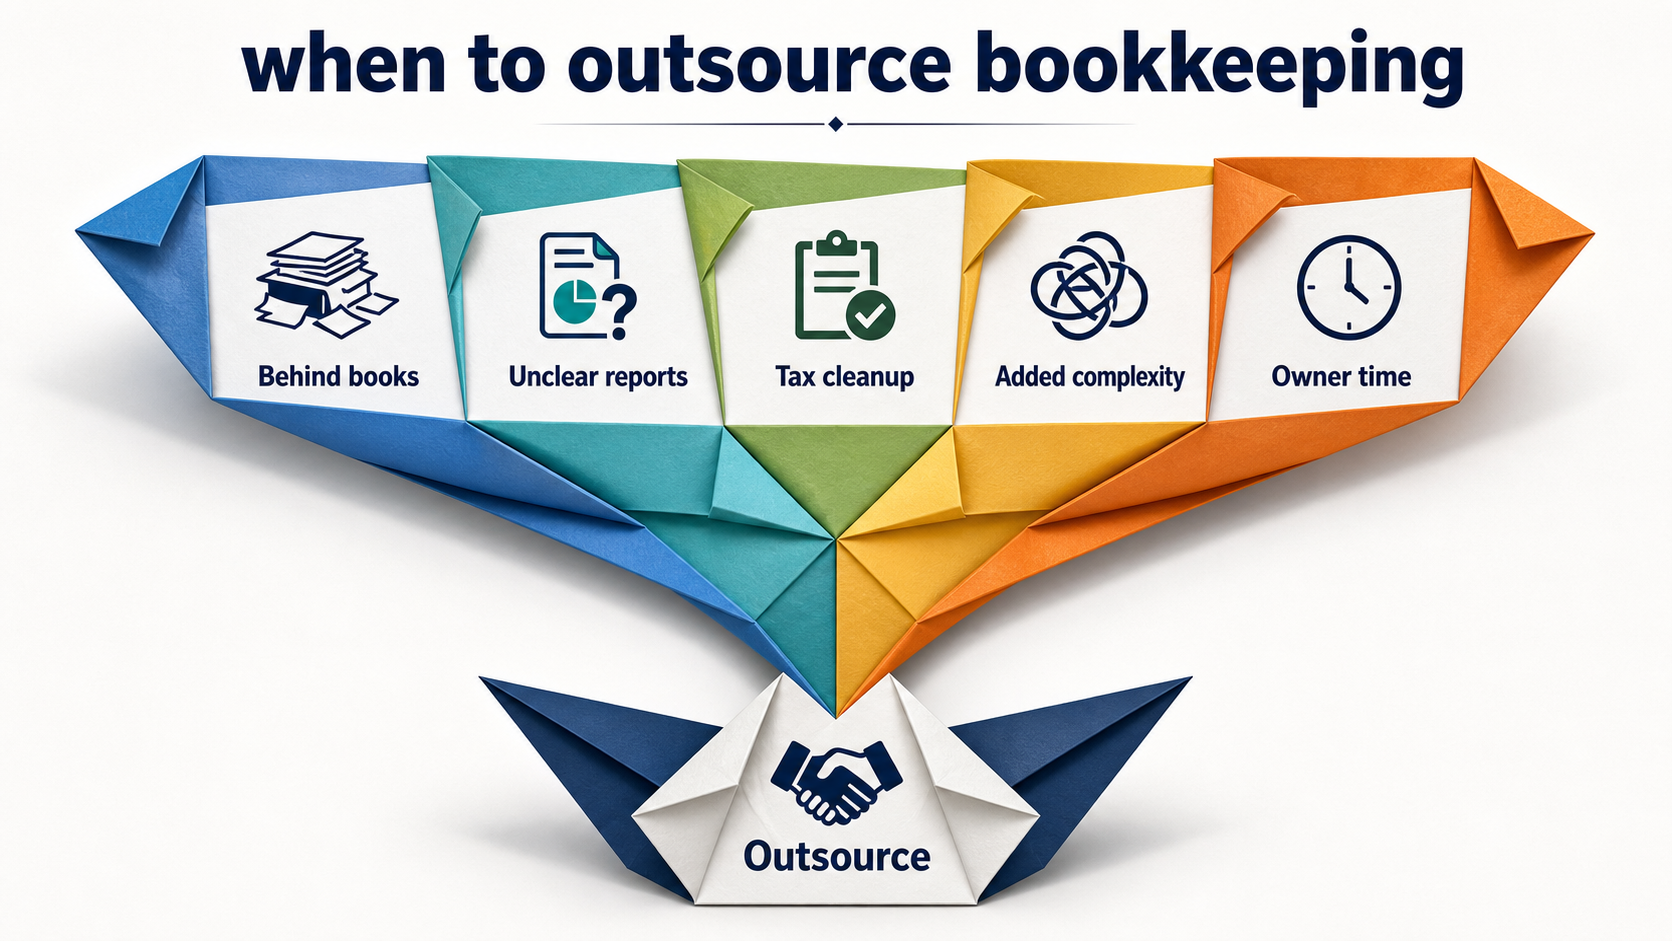
Learn when to outsource bookkeeping, what tasks to hand off first, and how outsourced bookkeeping supports tax planning and decisions.

Use this ecommerce sales tax checklist to review nexus, registrations, marketplaces, product taxability, filings, and bookkeeping records.