


Most CPA firm owners can tell you their revenue. Fewer can tell you their profit margin with any confidence. And almost none can tell you how their margin compares to firms of similar size.
This matters because profit margin is the single most important indicator of a firm's financial health. Revenue can grow while profitability shrinks. You can add clients, add staff, and add services, all while your margin quietly erodes. It happens slowly. It happens to well-run firms. And it happens most often because managing partners are looking at the top line when they should be watching the bottom line.
We work with CPA firms of every size, from solo practitioners to multi-office operations with 100+ staff. We see their financials. We understand where the money goes and where it leaks. Here are the benchmarks, the common margin killers, and the specific actions that move the needle.
The data below draws on the AICPA's MAP (Management of an Accounting Practice) Survey, the Rosenberg Survey, and our own observations from working with hundreds of firms. All figures represent net income as a percentage of net revenue (after owner compensation is normalized to market rates, not treated as profit).
Typical margin: 35% to 55%
Top performers: 55% to 65% Solo practitioners have the highest margins in the profession because their cost structure is minimal. No employees. No office (or a home office). Minimal technology overhead. Their revenue is essentially their labor multiplied by their billing rate, minus a handful of fixed costs.
But "profit margin" for a solo practitioner is somewhat misleading. A solo with $200,000 in revenue and a 50% margin has $100,000 in profit, but that includes their own compensation. Normalize for what they could earn as an employee elsewhere ($90,000 to $130,000), and the real entrepreneurial profit is often thin or negative. The high margin percentage masks a modest absolute number.
The margin killers for solos: underpricing services (especially for longtime clients), excessive time spent on non-billable activities (admin, marketing, technology troubleshooting), and the inability to delegate anything.
Typical margin: 25% to 40%
Top performers: 40% to 50% This is the most dangerous size for CPA firms. You have added staff, which means payroll, benefits, management responsibility, and overhead. But you have not yet reached the scale where those costs are spread efficiently.
The MAP Survey data consistently shows that firms in the 2 to 5 person range have the widest variance in profitability. The best small firms are highly profitable because the owner still handles the highest-value work personally while staff handles production. The worst small firms are barely breaking even because the owner added staff before they had enough volume to keep everyone busy, or because they are paying staff more than the work generates.
Common patterns we see at this size:
Typical margin: 20% to 35%
Top performers: 35% to 45% Something interesting happens in this size range. Margins typically compress from the small firm numbers before improving again as the firm approaches 20 people. The compression happens because mid-size firms take on the infrastructure of a real business (office lease, HR policies, professional development programs, middle management) without yet having the revenue to support it efficiently.
The Rosenberg Survey data shows that firms with $1M to $3M in revenue (roughly the 6 to 20 person range) spend 45% to 55% of revenue on personnel costs, 10% to 18% on occupancy and overhead, and 5% to 8% on technology and equipment. That leaves 20% to 35% as net income.
Top performers in this range do several things differently:
This mid-size range is where we see the most dramatic impact from outsourcing. A 12-person firm that moves 3 to 4 FTEs worth of production work offshore can improve margins by 8 to 15 percentage points while maintaining or increasing revenue. We will dig into this math later.
Typical margin: 25% to 38%
Top performers: 38% to 48% At this size, firms have developed genuine operational infrastructure. They have department heads, a managing partner focused on business development, established client portfolios, and enough scale to negotiate better vendor pricing. Margins recover from the mid-size compression and begin climbing again.
The MAP Survey shows that firms in the $3M to $8M revenue range (roughly 21 to 50 people) tend to spend 42% to 50% on personnel, 8% to 14% on occupancy, and 4% to 7% on technology. The remaining 25% to 38% is net income.
The performance gap between typical and top-performing firms narrows at this size because operational discipline is necessary for survival. You cannot run a 30-person firm on instinct the way you can run a 5-person firm. The firms that reach this size have already figured out most of the basics.
Where margin improvement happens at this level:
Typical margin: 28% to 42%
Top performers: 42% to 55% These firms are well-run businesses with professional management. The top performers in this category generate per-partner income of $400,000 to $800,000+ and achieve margins that rival the best small firms but at a completely different scale.
According to Rosenberg Survey data, the most profitable large firms share common characteristics:
The large firm margin story is fundamentally about leverage: how much revenue each partner can generate through the work of others. Firms with high leverage ratios (more staff per partner) and efficient delivery models consistently outperform peers with lower leverage.
Understanding the benchmarks is useful. Understanding where the money leaks is actionable. These are the most common margin killers we see across all firm sizes.
This is the single biggest structural margin problem in public accounting. Tax season requires 30% to 50% more capacity than the rest of the year. Most firms staff for peak, which means they carry excess capacity for 7 to 8 months. Those idle hours are pure margin destruction.
A staff accountant earning $65,000 per year costs roughly $5,400 per month fully loaded. If they are 50% utilized during the off-season (not uncommon), that is $2,700 per month in unrecoverable cost per idle employee. Multiply by 3 to 5 excess staff members across a 7-month off-season, and you are looking at $57,000 to $95,000 in annual margin leakage from overstaffing alone.
This is where outsourcing has the most direct impact on margin. Offshore staff can be engaged seasonally or scaled up and down with workload. You pay for production hours, not bench time. Our article on reducing staff turnover and burnout through outsourcing explores how this flexibility also improves retention of your core team.
Realization rate is the percentage of your standard fees that you actually collect. Industry average realization runs 85% to 92%. That means for every dollar of work performed at standard rates, firms collect 85 to 92 cents.
Where does the other 8% to 15% go? Write-offs. Partner discounts. Scope creep that never gets billed. Fixed-fee engagements that are underpriced. Clients who negotiate after the fact.
Improving realization from 88% to 95% on a $2M revenue base adds $140,000 to the bottom line. That is pure margin improvement with no additional work required.
The fix is not complicated, but it requires discipline: price engagements accurately, bill for scope changes, stop discounting for clients who do not deserve it, and fire clients who consistently demand write-offs.
The MAP Survey identifies staff utilization as the strongest predictor of firm profitability. Top-performing firms maintain utilization rates of 75% to 85% for professional staff. Median firms run 60% to 70%.
Each percentage point of utilization improvement translates to roughly 0.5% to 1% margin improvement, depending on the firm's leverage ratio. Moving from 65% to 75% utilization across a 10-person professional staff at average billing rates adds $75,000 to $150,000 to the bottom line.
How to improve utilization:
Many CPA firms, especially smaller ones, have not raised prices to keep up with the market. If your standard rates are 10% below market and your revenue is $2M, you are leaving $200,000 on the table. Every year.
The 2024 and 2025 Rosenberg Surveys documented average annual rate increases of 5% to 10% across the profession, driven by the talent shortage and rising costs. Firms that did not follow suit saw their margins erode even as their competitors' margins improved.
We see this constantly among the firms we work with. They are afraid to raise prices because they might lose clients. In reality, the clients they lose from a price increase are usually the lowest-margin clients they should have let go anyway.
CPA firms spend 4% to 8% of revenue on technology. That is appropriate. What is not appropriate is spending on tools that are duplicative, underutilized, or not actually improving productivity.
Common examples: paying for three different document management systems because nobody decided on one, maintaining desktop software licenses alongside cloud subscriptions for the same function, subscribing to practice management tools that nobody uses. A technology audit typically identifies 15% to 25% in savings on the tech stack.
We are an outsourcing provider, so take this section with appropriate context. But the math is straightforward and verifiable.
Moving production work offshore saves 50% to 70% on direct labor costs. A staff accountant in the US costs $94,000 to $145,000 fully loaded. The equivalent offshore resource costs $18,000 to $32,000. The savings on a 5-FTE shift to offshore is $300,000 to $550,000 per year.
Not all of that drops to the bottom line. You will spend on management overhead, review time, and onboarding. But in a mature engagement (beyond the first 90 days), the net savings are 40% to 60% of the gross labor savings. For a 5-FTE engagement, that is $120,000 to $330,000 in annual margin improvement.
Our cost analysis of outsourcing accounting services models this in detail across different firm sizes and service types.
Offshore teams can be scaled up for tax season and scaled back afterward. Instead of carrying 5 extra staff year-round, you maintain a base offshore team of 3 and add 2 more for January through April. The seasonal FTEs cost you for 4 months instead of 12, saving 67% on the seasonal capacity cost.
This is the margin impact most firms miss. When you move production work offshore, your US staff has more capacity. That capacity can be directed toward higher-value work: advisory services, new client acquisition, complex engagements that command premium pricing.
A senior accountant freed from 15 hours per week of production work can use that time for advisory engagements billed at $150 to $250 per hour. That is $117,000 to $195,000 in potential annual revenue from a single person, with no incremental cost beyond the offshore production support.
Here is what we typically see in the first 12 months of an outsourcing engagement, after the onboarding period:
5-person firm (2 FTEs offshore): Margin improvement of 8 to 12 percentage points. Revenue often increases 10% to 15% as the owner redirects freed time to business development.
12-person firm (4 FTEs offshore): Margin improvement of 10 to 15 percentage points. This is the sweet spot where outsourcing has the most dramatic percentage impact.
25-person firm (6-8 FTEs offshore): Margin improvement of 8 to 12 percentage points. The absolute dollar impact is larger, but the percentage impact is slightly lower because fixed costs are already better amortized.
50-person firm (10-15 FTEs offshore): Margin improvement of 6 to 10 percentage points. At this size, firms often use the savings to invest in growth (new offices, new service lines, acquisitions) rather than letting it all flow to the bottom line.
For a deeper dive into the financial model, see our offshore vs onshore cost comparison, which models the cost differences at 5, 10, and 25 FTE scales.
Based on the benchmarks and the margin leaks identified above, here are seven specific actions, roughly in order of impact:
1. Conduct a client profitability analysis. Sort your clients by profitability, not revenue. Identify the bottom 10%. Either raise their prices to market levels or transition them out. Every hour your team spends on a below-market client is an hour not spent on a profitable one.
2. Raise your standard rates. If you have not increased rates in the past 12 months, you are falling behind. The market supports 5% to 8% annual increases. Do it. Communicate it professionally. Accept the small number of clients who will leave because of it.
3. Move production work offshore. Start with bookkeeping, tax preparation, or both. A 3-FTE offshore team saves $120,000 to $200,000 per year in net labor costs while freeing your US staff for higher-value work. Our outsourced accounting services guide is a good starting point if you are new to this.
4. Improve staff utilization. Track utilization weekly, not annually. Address underutilization in real time. Cross-train staff to smooth out seasonal workload imbalances. Target 75% utilization for professional staff as a minimum.
5. Fix your realization rate. Implement engagement letter pricing for all clients. Bill for scope changes. Stop writing off time that was legitimately spent. A 5-point realization improvement on $2M revenue is $100,000 in margin.
6. Audit your technology spend. List every software subscription. Identify duplicates and underutilized tools. Consolidate where possible. This is a quick win that typically saves $10,000 to $30,000 per year with a week of effort.
7. Develop advisory services. Tax preparation and bookkeeping are commoditizing. Advisory services (virtual CFO, business consulting, strategic tax planning) command higher margins and are harder to commoditize. Even adding one advisory service line can shift your overall service mix toward higher-margin work.
Our guide on cutting costs 50% through outsourcing walks through items 3 and 4 in detail, with real examples and financial models.
Margin improvement requires measurement. Here are the metrics every CPA firm should track monthly:
The MAP Survey benchmarks for each of these are publicly available and updated annually. Track your numbers against these benchmarks quarterly and you will always know where you stand relative to your peers.
Here is the uncomfortable truth. Many CPA firms have mediocre margins not because they lack the knowledge to improve them, but because the managing partner avoids the difficult decisions that improvement requires.
Raising prices means awkward conversations with longtime clients. Firing unprofitable clients feels wrong when you have known them for 15 years. Outsourcing production work triggers anxiety about quality and control. Holding staff accountable for utilization feels overly corporate for a small firm culture.
These are all real concerns. But the alternative is working harder every year for the same or declining income. The firms with top-quartile margins are not necessarily smarter or luckier. They are more disciplined about these decisions.
If you want to explore how outsourcing specifically could impact your firm's margin, start a conversation with us at madrasaccountancy.com. We will model the financials based on your actual numbers, not hypothetical ranges, and show you what a 12-month margin improvement plan looks like with offshore support as a core component.
What is the average profit margin for a CPA firm? Based on the most recent AICPA MAP Survey and Rosenberg Survey data, the median net income margin (after normalizing owner compensation) is approximately 30% to 35% across all firm sizes. However, this number varies significantly by firm size, geography, and service mix. Top-quartile firms consistently achieve margins 10 to 15 percentage points above the median.
How much can outsourcing realistically improve my margin? In our experience, outsourcing 3 to 5 FTEs of production work improves net margins by 8 to 15 percentage points in the first 12 months after the onboarding period. The exact impact depends on your current cost structure, the services outsourced, and how you redeploy the freed US staff capacity.
Should I focus on growing revenue or improving margin? Both, but margin first. Revenue growth with poor margins just scales your problems. A firm with 20% margins that grows revenue 20% adds the same bottom-line dollars as a firm with 40% margins that grows revenue 10%. Fix the margin first, then grow.
How often should I benchmark my firm's profitability? Quarterly at minimum. Monthly is better. The AICPA MAP Survey provides annual benchmarks by firm size, revenue, and geography. The Rosenberg Survey provides additional data points for firms above $2M in revenue. Both are worth the investment.
What is the biggest mistake firms make when trying to improve margins? Cutting costs without a strategy. Across-the-board cost cuts (reducing staff, eliminating training, dropping technology tools) often hurt productivity and morale, offsetting the savings. Targeted margin improvement, replacing high-cost production labor with lower-cost offshore alternatives while redeploying US staff to higher-value work, preserves capacity while reducing cost.
Related read: profit margin.
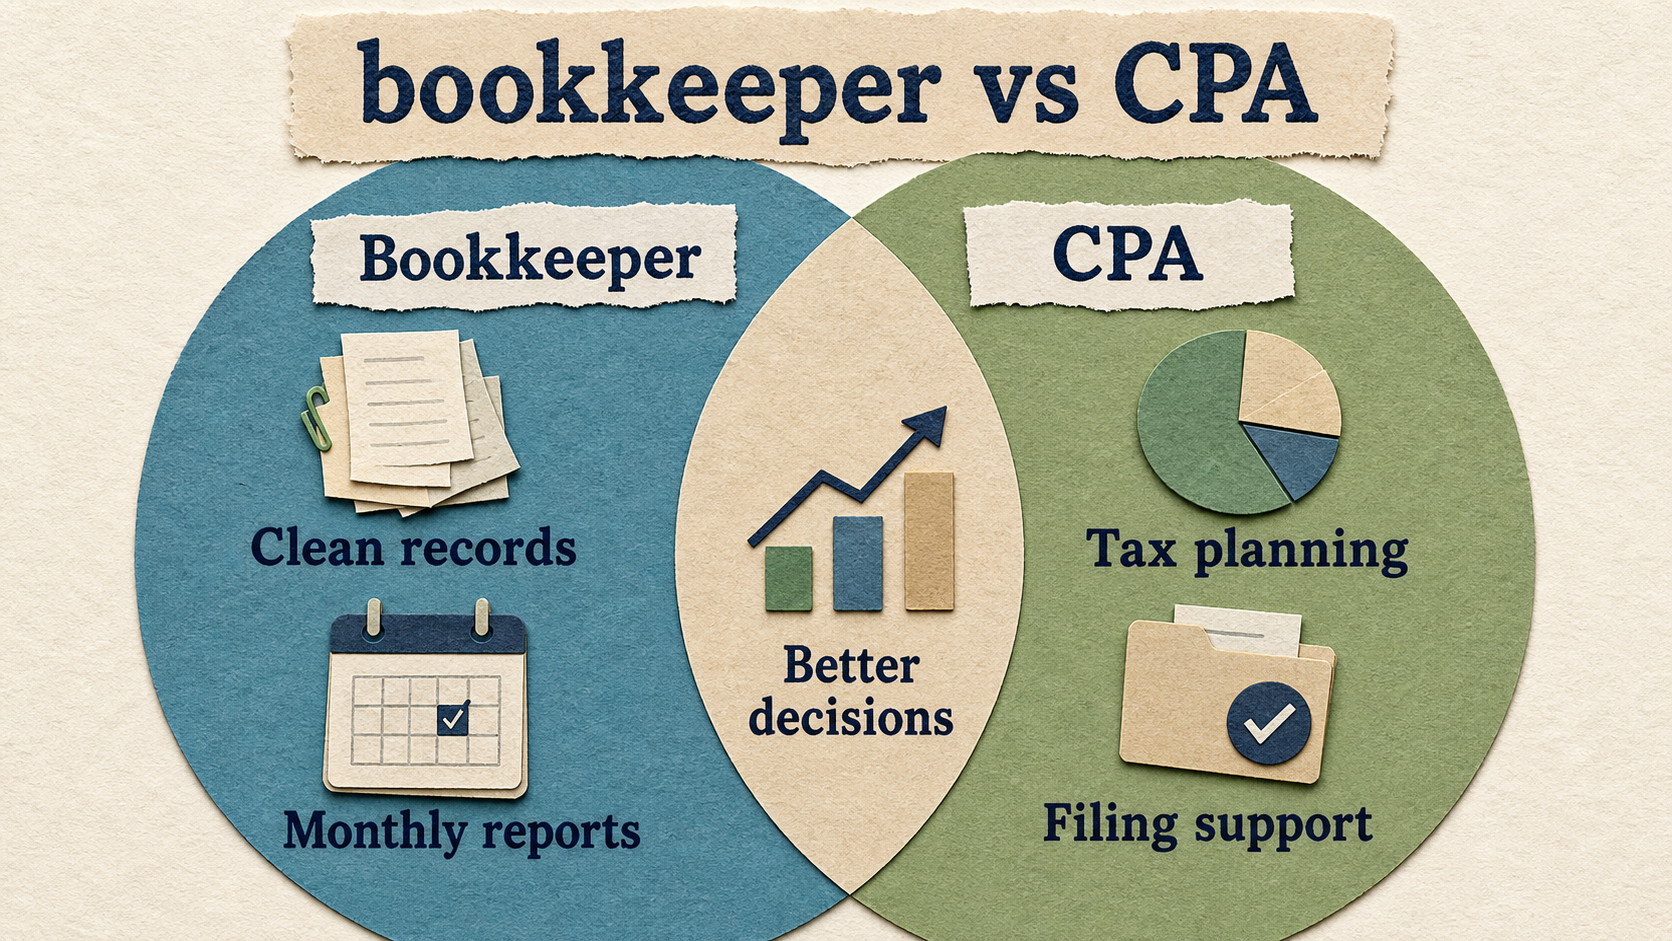
Compare a bookkeeper and CPA so your business knows when it needs recordkeeping, tax filing, planning, or higher-level advice.
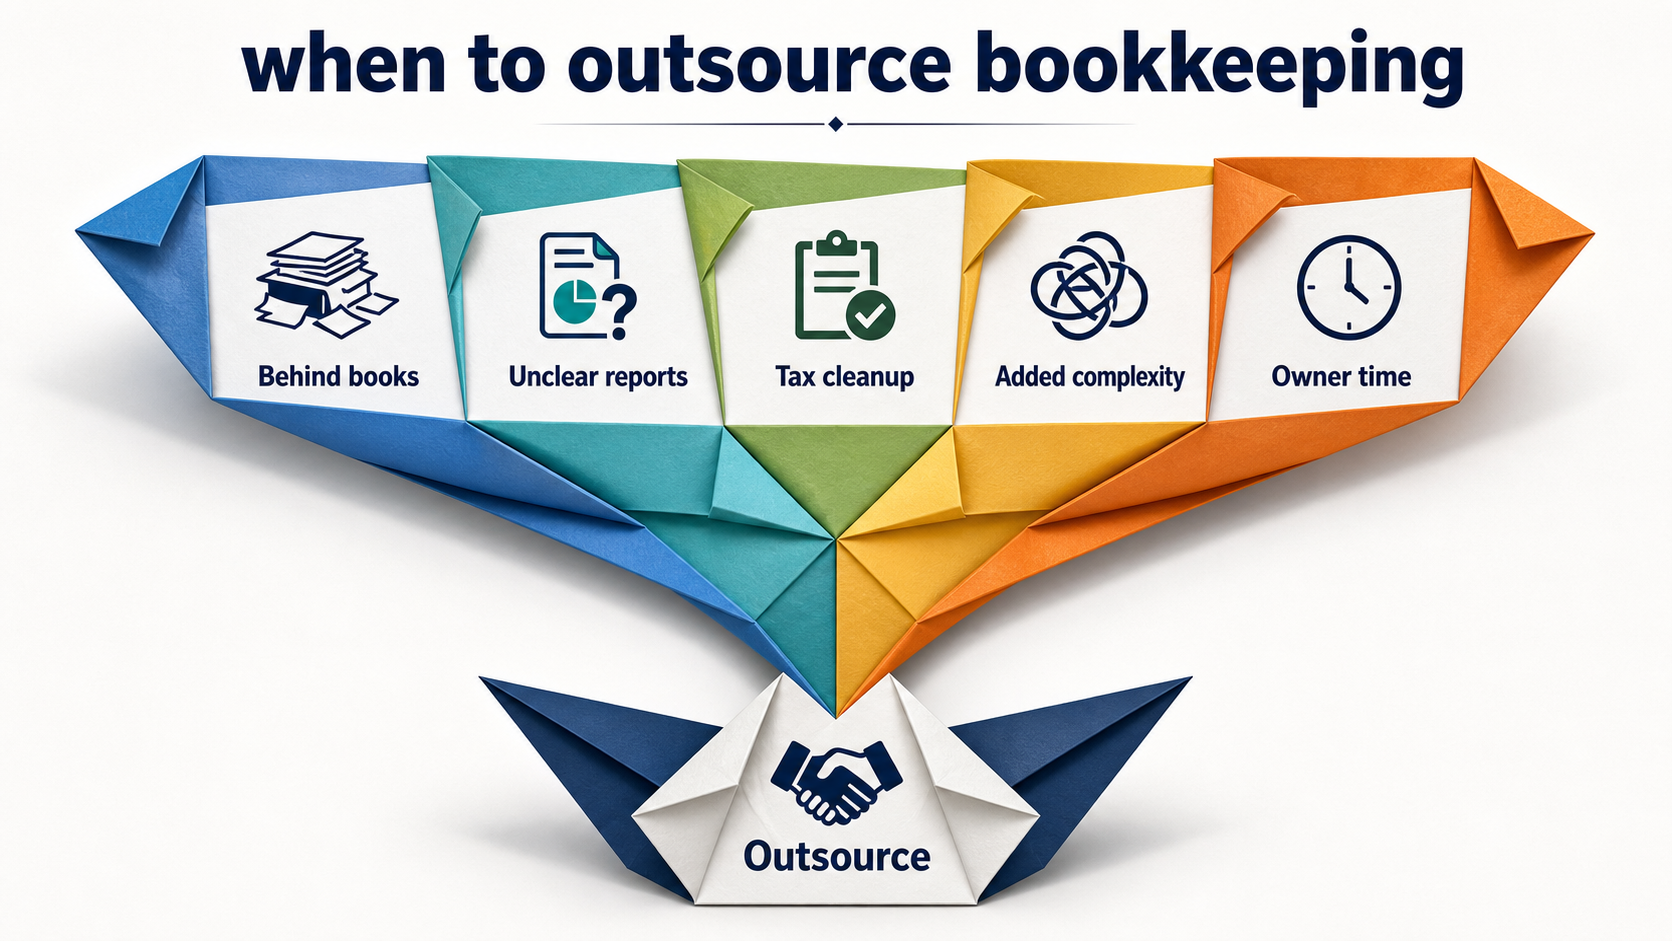
Learn when to outsource bookkeeping, what tasks to hand off first, and how outsourced bookkeeping supports tax planning and decisions.

Use this ecommerce sales tax checklist to review nexus, registrations, marketplaces, product taxability, filings, and bookkeeping records.