.png)

Rental property cash flow analysis calculates the money you actually keep each month after paying all expenses, debt service, and reserves. It starts with gross rental income, subtracts operating expenses (property taxes, insurance, maintenance, management fees), then deducts mortgage payments and capital reserves.
Positive cash flow means the property generates income; negative means you're paying monthly to own it.
Investors who run proper cash flow analyses before buying avoid properties that look profitable on paper but drain $300-$800 monthly in reality.
You're analyzing a rental property. The seller's pro forma shows $3,200 monthly rent and $2,400 in expenses, leaving $800 cash flow. You buy it. Six months later, you're writing $400 checks monthly to cover the shortfall. The seller underestimated property taxes by $200, ignored $150 in monthly maintenance, and assumed zero vacancy, mistakes that cost you $4,800 annually.
Real estate investors who skip thorough cash flow analysis lose an average of $5,000-$15,000 annually on poorly performing properties. Overly optimistic rent assumptions, understated expenses, and failure to account for vacancy create negative cash flow that destroys returns. Here's the exact 8-step framework used by successful investors to analyze rental property cash flow and identify deals that actually generate income versus those that look good on a spreadsheet but bleed money in reality.
Cash flow is the net amount of money you receive from a rental property each month after paying all operating expenses, mortgage payments, and setting aside capital reserves. It's the real spendable income the property generates, not accounting profit, not appreciation, but actual cash in your pocket.
Positive cash flow means the property generates more income than expenses. A property producing $800 monthly cash flow generates $9,600 annually in distributable income. Negative cash flow means you're subsidizing the property monthly. Many investors accept $200-$300 negative cash flow counting on appreciation, but this strategy requires substantial reserves and creates risk if appreciation doesn't materialize.
Cash flow determines whether a rental property functions as an investment or an expensive hobby. Properties generating $500-$1,000+ monthly cash flow create wealth and fund portfolio growth. Properties requiring monthly subsidies drain capital you could deploy into better investments. The difference between $800 positive and $400 negative cash flow is $14,400 annually, enough to fund another property purchase or cover an entire year of living expenses.
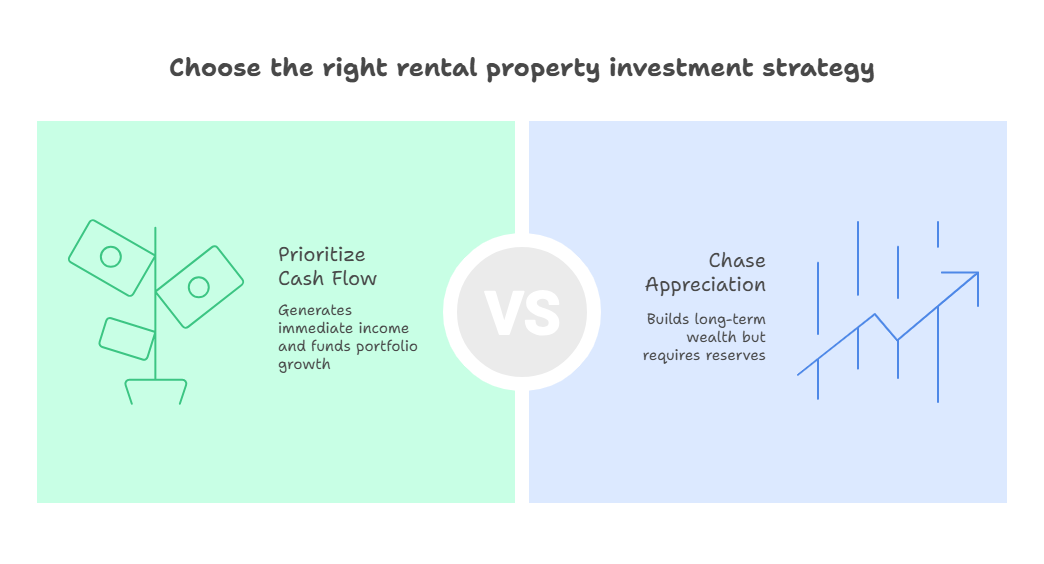
Appreciation builds long-term wealth, but cash flow funds your life today. Properties in high-appreciation markets often generate minimal or negative cash flow because purchase prices exceed what rents can support. Investors must decide: chase appreciation with weak cash flow, or prioritize cash flow in markets with moderate appreciation. Both strategies work, but the choice determines your investment timeline and capital requirements.
Gross rental income is your starting point, the total rent collected if the property stays 100% occupied year-round. For a single-family home renting at $2,400 monthly, gross rental income is $28,800 annually. However, no property achieves 100% occupancy forever, so gross rental income represents the maximum possible, not actual income.
Operating expenses include everything required to operate and maintain the property: property taxes, insurance, HOA fees, property management (typically 8-10% of rent), maintenance and repairs, utilities you pay, landscaping, pest control, and marketing costs. Operating expenses typically consume 35-50% of gross rental income, with older properties trending toward the higher end.
Debt service is your mortgage payment, principal and interest.
A $400,000 loan at 7% for 30 years costs $2,661 monthly or $31,932 annually. Interest is tax-deductible; principal payments are not, though they do build equity. Many beginning investors forget that building equity through principal paydown isn't the same as generating cash, you can't spend equity without refinancing or selling.
Capital reserves cover major replacements and repairs: roofs, HVAC systems, water heaters, appliances, and structural issues. Experienced investors set aside 5-10% of gross income ($120-$240 monthly on a $2,400 rental) for capital expenditures. Skip this reserve and you'll scramble when the $8,000 roof replacement hits year three.
Net operating income (NOI) equals gross income minus operating expenses before debt service. NOI measures the property's operational performance independent of financing. A property generating $28,800 gross income with $14,400 in operating expenses has $14,400 NOI, this number determines property value when using cap rates for valuation.
Start with realistic gross rental income. Research actual rents for comparable properties using Zillow, Rentometer, or local property management companies. Use the low end of the range, if comparable properties rent for $2,200-$2,600, use $2,300 for projections. Overestimating rent by $200 monthly creates $2,400 annual shortfalls that destroy returns.
Account for vacancy. Even well-managed properties experience turnover. Use 5-10% vacancy for strong rental markets, 10-15% for average markets, and 15-20% for weaker markets or properties requiring tenant improvements between leases. A $2,400 rental with 8% vacancy generates $26,496 effective gross income, not $28,800.
Calculate operating expenses item by item. Property taxes from county records, insurance quotes from actual agents, HOA fees from association documents. Estimate maintenance at 1% of property value annually ($4,000 on a $400,000 property), though older properties may require 1.5-2%. Add property management at 8-10% even if self-managing, your time has value and you might eventually hire management.
Include capital reserves. Budget 5-10% of effective gross income for major repairs and replacements. Properties with newer mechanicals can use 5%; older properties need 10%. A property generating $26,496 effective gross income should reserve $1,325-$2,650 annually ($110-$220 monthly) for capital expenditures.
Subtract debt service. Use actual mortgage payments based on current interest rates and your expected down payment. For a $400,000 property with 20% down ($320,000 loan at 7% for 30 years), monthly payment is $2,129 or $25,548 annually. Remember that in early years, 80-85% goes toward interest, with only 15-20% reducing principal.
The comprehensive approach to analyzing rental income and expenses parallels techniques we use in our cash flow forecasting services for businesses, where accurate projection of income, expenses, and timing determines whether operations generate positive cash or require capital infusions.
Cash-on-cash return divides annual cash flow by total cash invested. If you invest $100,000 (down payment plus closing costs) and generate $8,400 annual cash flow, your cash-on-cash return is 8.4%. This metric shows your actual return on invested capital, making it easier to compare rental properties against alternative investments like REITs or dividend stocks.
Cap rate (capitalization rate) divides net operating income by property value. A property generating $14,400 NOI worth $240,000 has a 6% cap rate ($14,400 ÷ $240,000).
Cap rates vary by market, secondary markets might offer 8-10%, while major metros range from 4-6%. Higher cap rates indicate stronger cash flow but often come with higher risk or lower appreciation potential.
Gross rent multiplier (GRM) divides purchase price by gross annual rent. A $240,000 property renting for $2,000 monthly ($24,000 annually) has a GRM of 10. Lower GRMs indicate better potential cash flow. Markets with GRMs under 12 typically generate positive cash flow; GRMs above 15 often require significant appreciation to justify the investment.
Debt service coverage ratio (DSCR) divides net operating income by annual debt service. Commercial lenders typically require 1.2-1.25 DSCR minimum. A property generating $18,000 NOI with $15,000 annual debt service has 1.2 DSCR, barely meeting commercial lending standards. Below 1.0 means the property can't cover its mortgage from rental income alone.
Break-even occupancy shows what percentage of units must stay rented to cover all expenses. Calculate by dividing operating expenses plus debt service by gross potential income. A property requiring $36,000 annually (expenses plus mortgage) with $40,000 gross potential income needs 90% occupancy to break even. Lower break-even points provide more safety margin against vacancy and rent reductions.
The most expensive mistake is using optimistic pro forma numbers from sellers or listing agents. Sellers routinely understate expenses by 20-40% and overstate rents by 10-15% to make properties appear more profitable. Always verify every number independently, call property management companies for actual rent ranges, get insurance quotes, check property tax records, and add 10-15% contingency to seller expense estimates.
Many investors forget to account for vacancy, treating gross potential income as actual income. Even 5% vacancy (18 days annually) reduces a $30,000 gross income property to $28,500 effective income, $1,500 that vanishes from cash flow. Properties between tenants for two months lose 17% of annual income. Factor vacancy into every analysis, even if you plan to maintain high occupancy.
Underestimating maintenance costs destroys cash flow projections. Newer investors budget $50-$100 monthly for maintenance, then face $8,000 roof repairs, $5,000 HVAC replacements, or $3,000 plumbing emergencies. Budget 1% of property value annually minimum ($333 monthly on a $400,000 property), and increase to 1.5-2% for properties over 20 years old.
Ignoring property management costs creates misleading cash flow numbers. Even self-managing investors should budget 8-10% management fees because most eventually hire managers or need to value their time properly. Properties showing positive cash flow only when self-managed rarely qualify as good investments, you're buying a job, not an investment.
Failing to stress-test assumptions leads to surprises. What happens if rents drop 10%? Interest rates rise when you refinance? Property taxes increase 20% after reassessment? Vacancy hits 20% during a recession? Run sensitivity analyses showing cash flow under pessimistic scenarios. Properties that work only under optimistic assumptions create risk most investors can't afford.
Spreadsheet templates streamline analysis and reduce errors. Build a template calculating cash flow automatically when you input purchase price, expected rent, expenses, and financing terms. Include separate tabs for multiple properties, sensitivity analysis, and year-by-year projections accounting for rent growth, expense inflation, and mortgage amortization.
Property analysis software like DealCheck, REI BlackBook, or Stessa provides standardized frameworks ensuring you don't miss expense categories. These tools calculate all key metrics instantly, cash-on-cash return, cap rate, DSCR, break-even occupancy, and generate professional reports for lenders or partners. Most cost $10-$30 monthly and pay for themselves by preventing one bad purchase.
Market research tools like Rentometer, Zillow, or Apartments.com provide comparable rent data in seconds. Rather than guessing market rents, you get actual asking prices for similar properties in the same neighborhood. This prevents optimistic rent assumptions that doom cash flow from day one.
Property management software tracks actual income and expenses, helping you refine future projections based on real performance data. Systems like AppFolio, Buildium, or TenantCloud generate reports showing exactly where your money goes, revealing expense categories you underestimated in your initial analysis.
Understanding financial data and creating actionable projections requires the same analytical skills we apply in our guide to reading and understanding financial statements, where properly interpreting income, expenses, and cash flow determines whether businesses (or rental properties) truly generate profits or just appear profitable on paper.

Negative cash flow can work in high-appreciation markets where property values grow 5-8% annually. If you subsidize a property $300 monthly ($3,600 annually) but it appreciates $30,000, the net position remains strongly positive. However, this strategy requires substantial reserves to cover monthly shortfalls for 3-5+ years until appreciation materializes or rents rise enough to flip cash flow positive.
Properties in transitional neighborhoods often show initial negative cash flow but strong future potential. If you buy in a neighborhood experiencing revitalization, $400 monthly subsidy might be acceptable if rents will grow 20-30% over three years as the area improves. This requires accurate market timing and deep local knowledge, mistiming gentrification by two years drains $10,000+ in subsidies.
Short-term rental properties sometimes justify temporary negative cash flow during their first year. Startup costs for furnishing, photography, marketing, and building reviews can create first-year negative cash flow even when the underlying economics work. If projections show positive cash flow by month 12-18, initial losses might be acceptable.
Never accept negative cash flow on a cash-flowing property just because you overpaid. Many investors rationalize negative cash flow by citing appreciation or tax benefits, when the real problem is paying too much. Properties generating positive cash flow for other investors but negative for you indicate you overpaid by 15-25% and should have negotiated better or walked away.
Portfolio-level cash flow analysis aggregates all properties to show total monthly and annual cash generation. Five properties each generating $600 monthly produce $36,000 annual cash flow, enough to fund living expenses or accelerate acquisition of properties six through ten. Track portfolio metrics quarterly to identify underperforming properties dragging down overall returns.
Cross-collateralization risk increases as portfolios grow. If one property requires capital infusions, positive cash flow from other properties might subsidize it temporarily. But if multiple properties hit problems simultaneously, major repairs, extended vacancies, rent reductions, the portfolio can turn negative quickly. Maintain reserves equal to 6-12 months of total portfolio expenses to weather downturns.
Diversification by property type and location reduces portfolio risk. Five properties in one neighborhood face correlated risk, if the area declines, all properties suffer simultaneously. Mixing single-family rentals with duplexes or small multifamily units across different submarkets creates more stable cash flow when individual properties underperform.
Tax implications multiply with portfolio scale. Depreciation deductions, passive activity losses, and potential real estate professional status qualification can reduce or eliminate income taxes on rental cash flow. However, managing the bookkeeping, expense tracking, and tax reporting for 5-10+ properties requires systems and potentially professional help.
For investors managing multiple rental properties, the complexity mirrors challenges faced by businesses tracking multiple revenue streams and expense centers. Our fractional CFO services for growing businesses provide similar financial analysis, reporting, and strategic planning that real estate investors need when portfolios reach 5-10+ properties and require professional-grade financial management.
Free rental property calculators from BiggerPockets, Zillow, or Rentometer provide quick initial analyses. Input purchase price, rent, expenses, and financing to get instant cash flow projections and key metrics. These work well for preliminary screening, run 10-20 properties through calculators in an hour to identify the 2-3 worth deeper analysis.
Spreadsheet templates offer more customization and control. Create templates with your specific market assumptions, typical expense ratios, and preferred metrics. Save templates for different property types (single-family, duplex, small multifamily) so you can analyze deals quickly with location-specific adjustments.
Property management companies provide market rent surveys showing actual rents achieved on comparable properties. Many offer free rent analysis reports to prospective clients. These reports beat online estimates because they reflect actual lease rates, not asking prices that might be 5-10% above market.
County assessor websites reveal property tax history and trends. Check not just current taxes but 3-5 year trends to identify markets with rapidly rising assessments. Properties in areas with 8-10% annual tax increases will see cash flow compressed over time as this major expense category grows faster than rents.
Insurance agents provide quotes based on actual property characteristics, coverage needs, and claims history. Online estimates are often 20-40% below actual costs. Get three quotes before finalizing analysis, insurance can easily run $150-$250 monthly on a $400,000 property, and underestimating by $100 monthly destroys $1,200 annual cash flow.
Bottom Line: Rental property cash flow analysis requires calculating effective gross income (rent minus vacancy), subtracting operating expenses (35-50% of income), debt service, and capital reserves (5-10% of income). Properties generating $500-$1,000+ monthly cash flow build wealth; properties requiring monthly subsidies drain capital unless appreciation justifies the negative carry. Verify every number independently, seller pro formas routinely overstate rent by 10-15% and understate expenses by 20-40%.
8-Step Cash Flow Analysis Process:
Good cash flow ranges from $200-$400 per unit monthly minimum, with experienced investors targeting $400-$800+ per unit. Single-family homes generating $500-$800 monthly and small multifamily properties producing $300-$500 per unit create strong returns. Properties generating less than $200 monthly per unit offer minimal margin for error, one major repair or extended vacancy can flip them negative. Target 8-12% cash-on-cash return as a benchmark for good cash flow performance.
Effective gross income equals gross potential rent multiplied by (1 - vacancy rate). For a property renting at $2,500 monthly with 8% expected vacancy: $2,500 × 12 months = $30,000 gross potential income. Then $30,000 × (1 - 0.08) = $27,600 effective gross income. Always account for vacancy, even well-managed properties experience turnover. Use 5-10% for strong markets, 10-15% for average markets, and 15-20% for weaker markets or older properties requiring more tenant improvements.
Operating expenses typically consume 35-50% of gross rental income, with older properties trending toward the higher end. This includes property taxes, insurance, maintenance, property management, utilities, HOA fees, and marketing. Additionally, set aside 5-10% for capital reserves (major repairs and replacements). After adding mortgage payments, most properties keep 15-35% of gross income as cash flow. Properties where expenses exceed 50-55% of income rarely generate positive cash flow unless purchased with substantial down payments reducing debt service.
No. Principal paydown builds equity but doesn't generate spendable cash flow. Only interest (the expense portion of your mortgage payment) should be deducted when calculating cash flow because you can't spend equity without refinancing or selling. A $2,500 monthly mortgage might include $2,100 interest and $400 principal in early years. Deduct the full $2,500 from cash flow because it's cash leaving your pocket monthly, but understand that $400 is building wealth through equity accumulation rather than representing a true expense.
Budget 1% of property value annually minimum for maintenance and repairs ($333 monthly on a $400,000 property), with older properties requiring 1.5-2%. This covers routine items like HVAC servicing, plumbing repairs, painting, and minor fixes. Separately reserve 5-10% of effective gross income for capital expenditures, major replacements like roofs ($10,000-$20,000), HVAC systems ($5,000-$12,000), and water heaters ($1,500-$3,000). Properties with newer mechanicals can use lower percentages; older properties need higher reserves.
Cash flow is the monthly or annual cash you receive after all expenses, debt service, and reserves. ROI (return on investment) measures total return including cash flow, principal paydown, appreciation, and tax benefits. A property might generate 8% cash-on-cash return (cash flow ÷ cash invested) but 15% total ROI when adding principal reduction and appreciation. Investors focused on current income prioritize cash flow; wealth builders accept lower cash flow for higher total ROI through appreciation and equity growth.
No. Sellers and listing agents routinely present pro forma numbers overstating income by 10-15% and understating expenses by 20-40% to make properties appear more profitable. Always verify independently: research actual market rents on Rentometer or Zillow, get insurance quotes from multiple agents, check property tax records at the county assessor, and add 10-15% contingency to expense estimates. Request 2-3 years of actual operating statements from the seller, then verify key expense categories independently. Never make decisions based solely on seller projections.
Madras Accountancy provides financial analysis and CFO services for real estate investors managing multiple properties or building portfolios. We create standardized cash flow analysis templates, build property-level and portfolio-level reporting, track actual versus projected performance, and provide tax planning to maximize after-tax cash flow.
Since 2015, we've helped 300+ real estate investors optimize their property finances, identifying an average of $8,000-$15,000 in missed tax deductions and structural improvements per portfolio annually. Our offshore model delivers fractional CFO expertise at 40% lower cost than traditional financial advisory services.
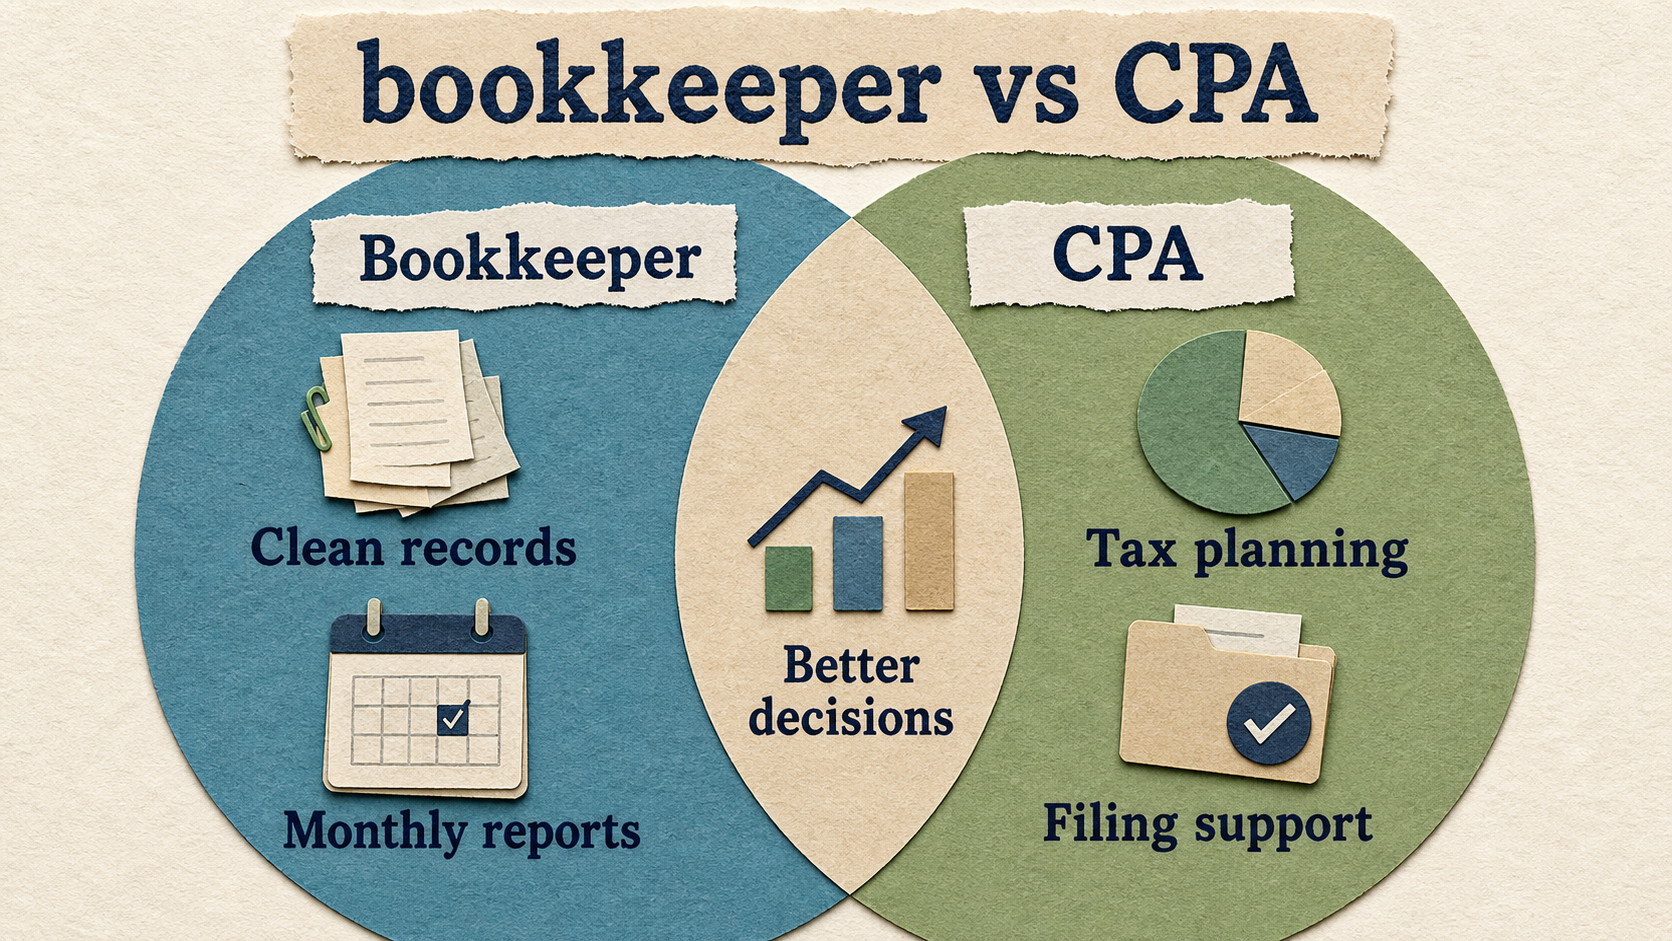
Compare a bookkeeper and CPA so your business knows when it needs recordkeeping, tax filing, planning, or higher-level advice.
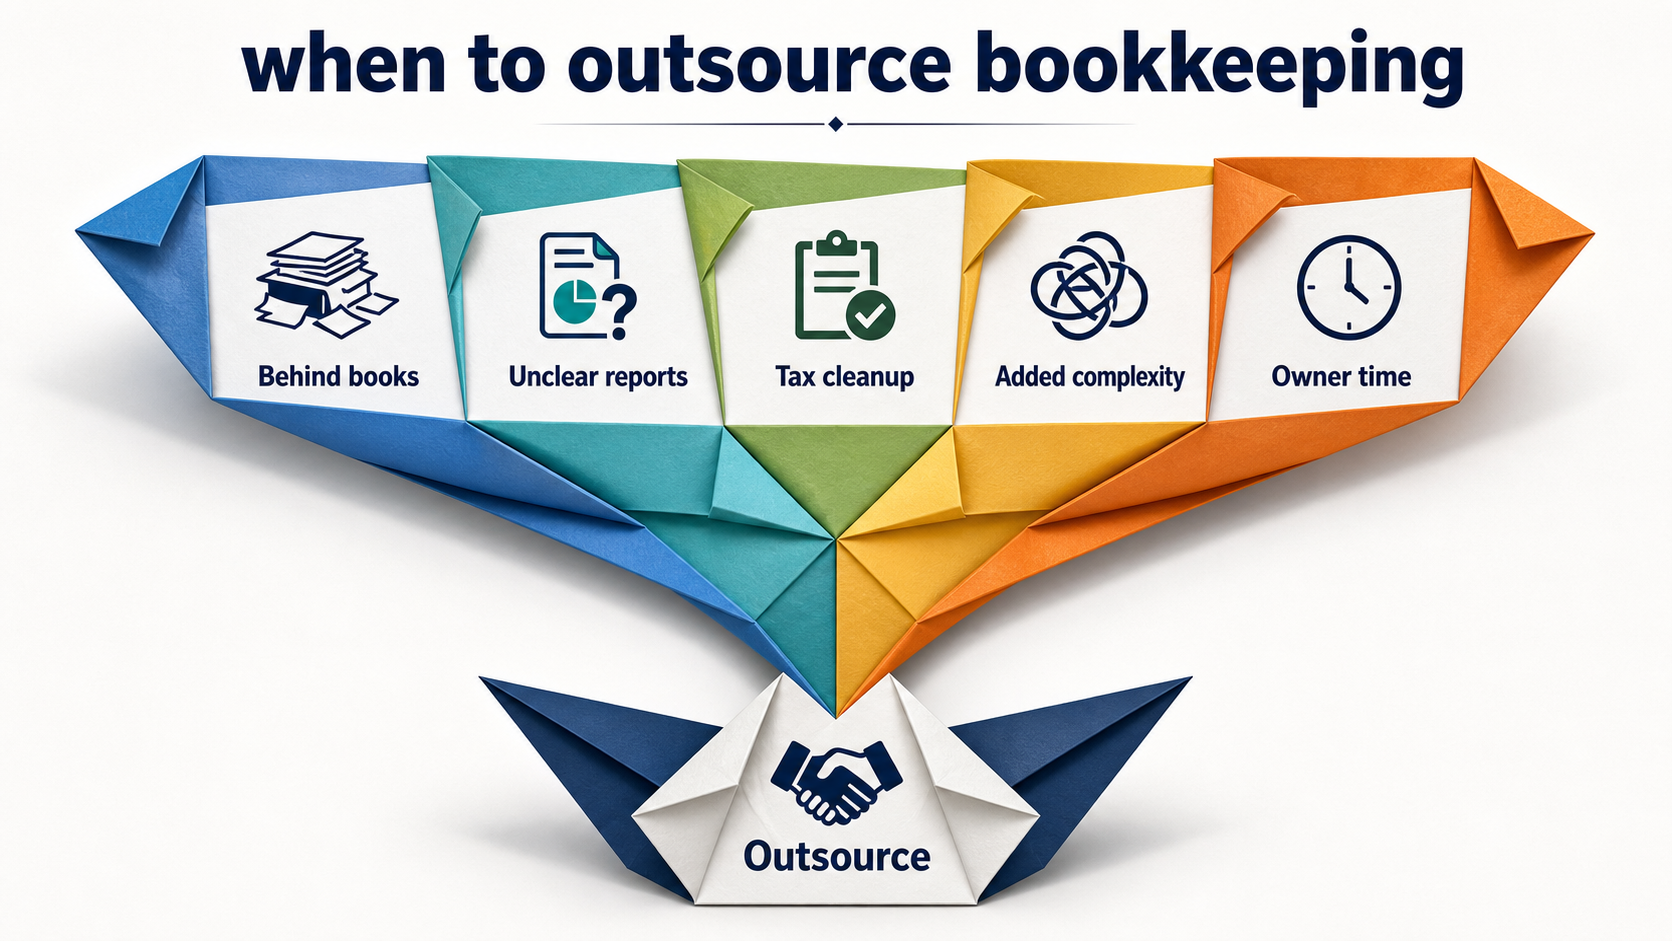
Learn when to outsource bookkeeping, what tasks to hand off first, and how outsourced bookkeeping supports tax planning and decisions.

Use this ecommerce sales tax checklist to review nexus, registrations, marketplaces, product taxability, filings, and bookkeeping records.