

Revenue and billable hours. That is what most managing partners look at when they open their dashboard on Monday morning. Revenue tells you what happened. Billable hours tell you how busy people were. Neither tells you whether the firm is actually healthy, whether clients are profitable, or whether your capacity can support growth.
We work with CPA firms across the US at Madras Accountancy, and the firms that grow consistently and maintain healthy margins are the ones tracking metrics that actually drive decisions. Not vanity metrics. Not 50 KPIs on a spreadsheet nobody opens. Fifteen numbers that tell you exactly where your firm stands and what needs to change.
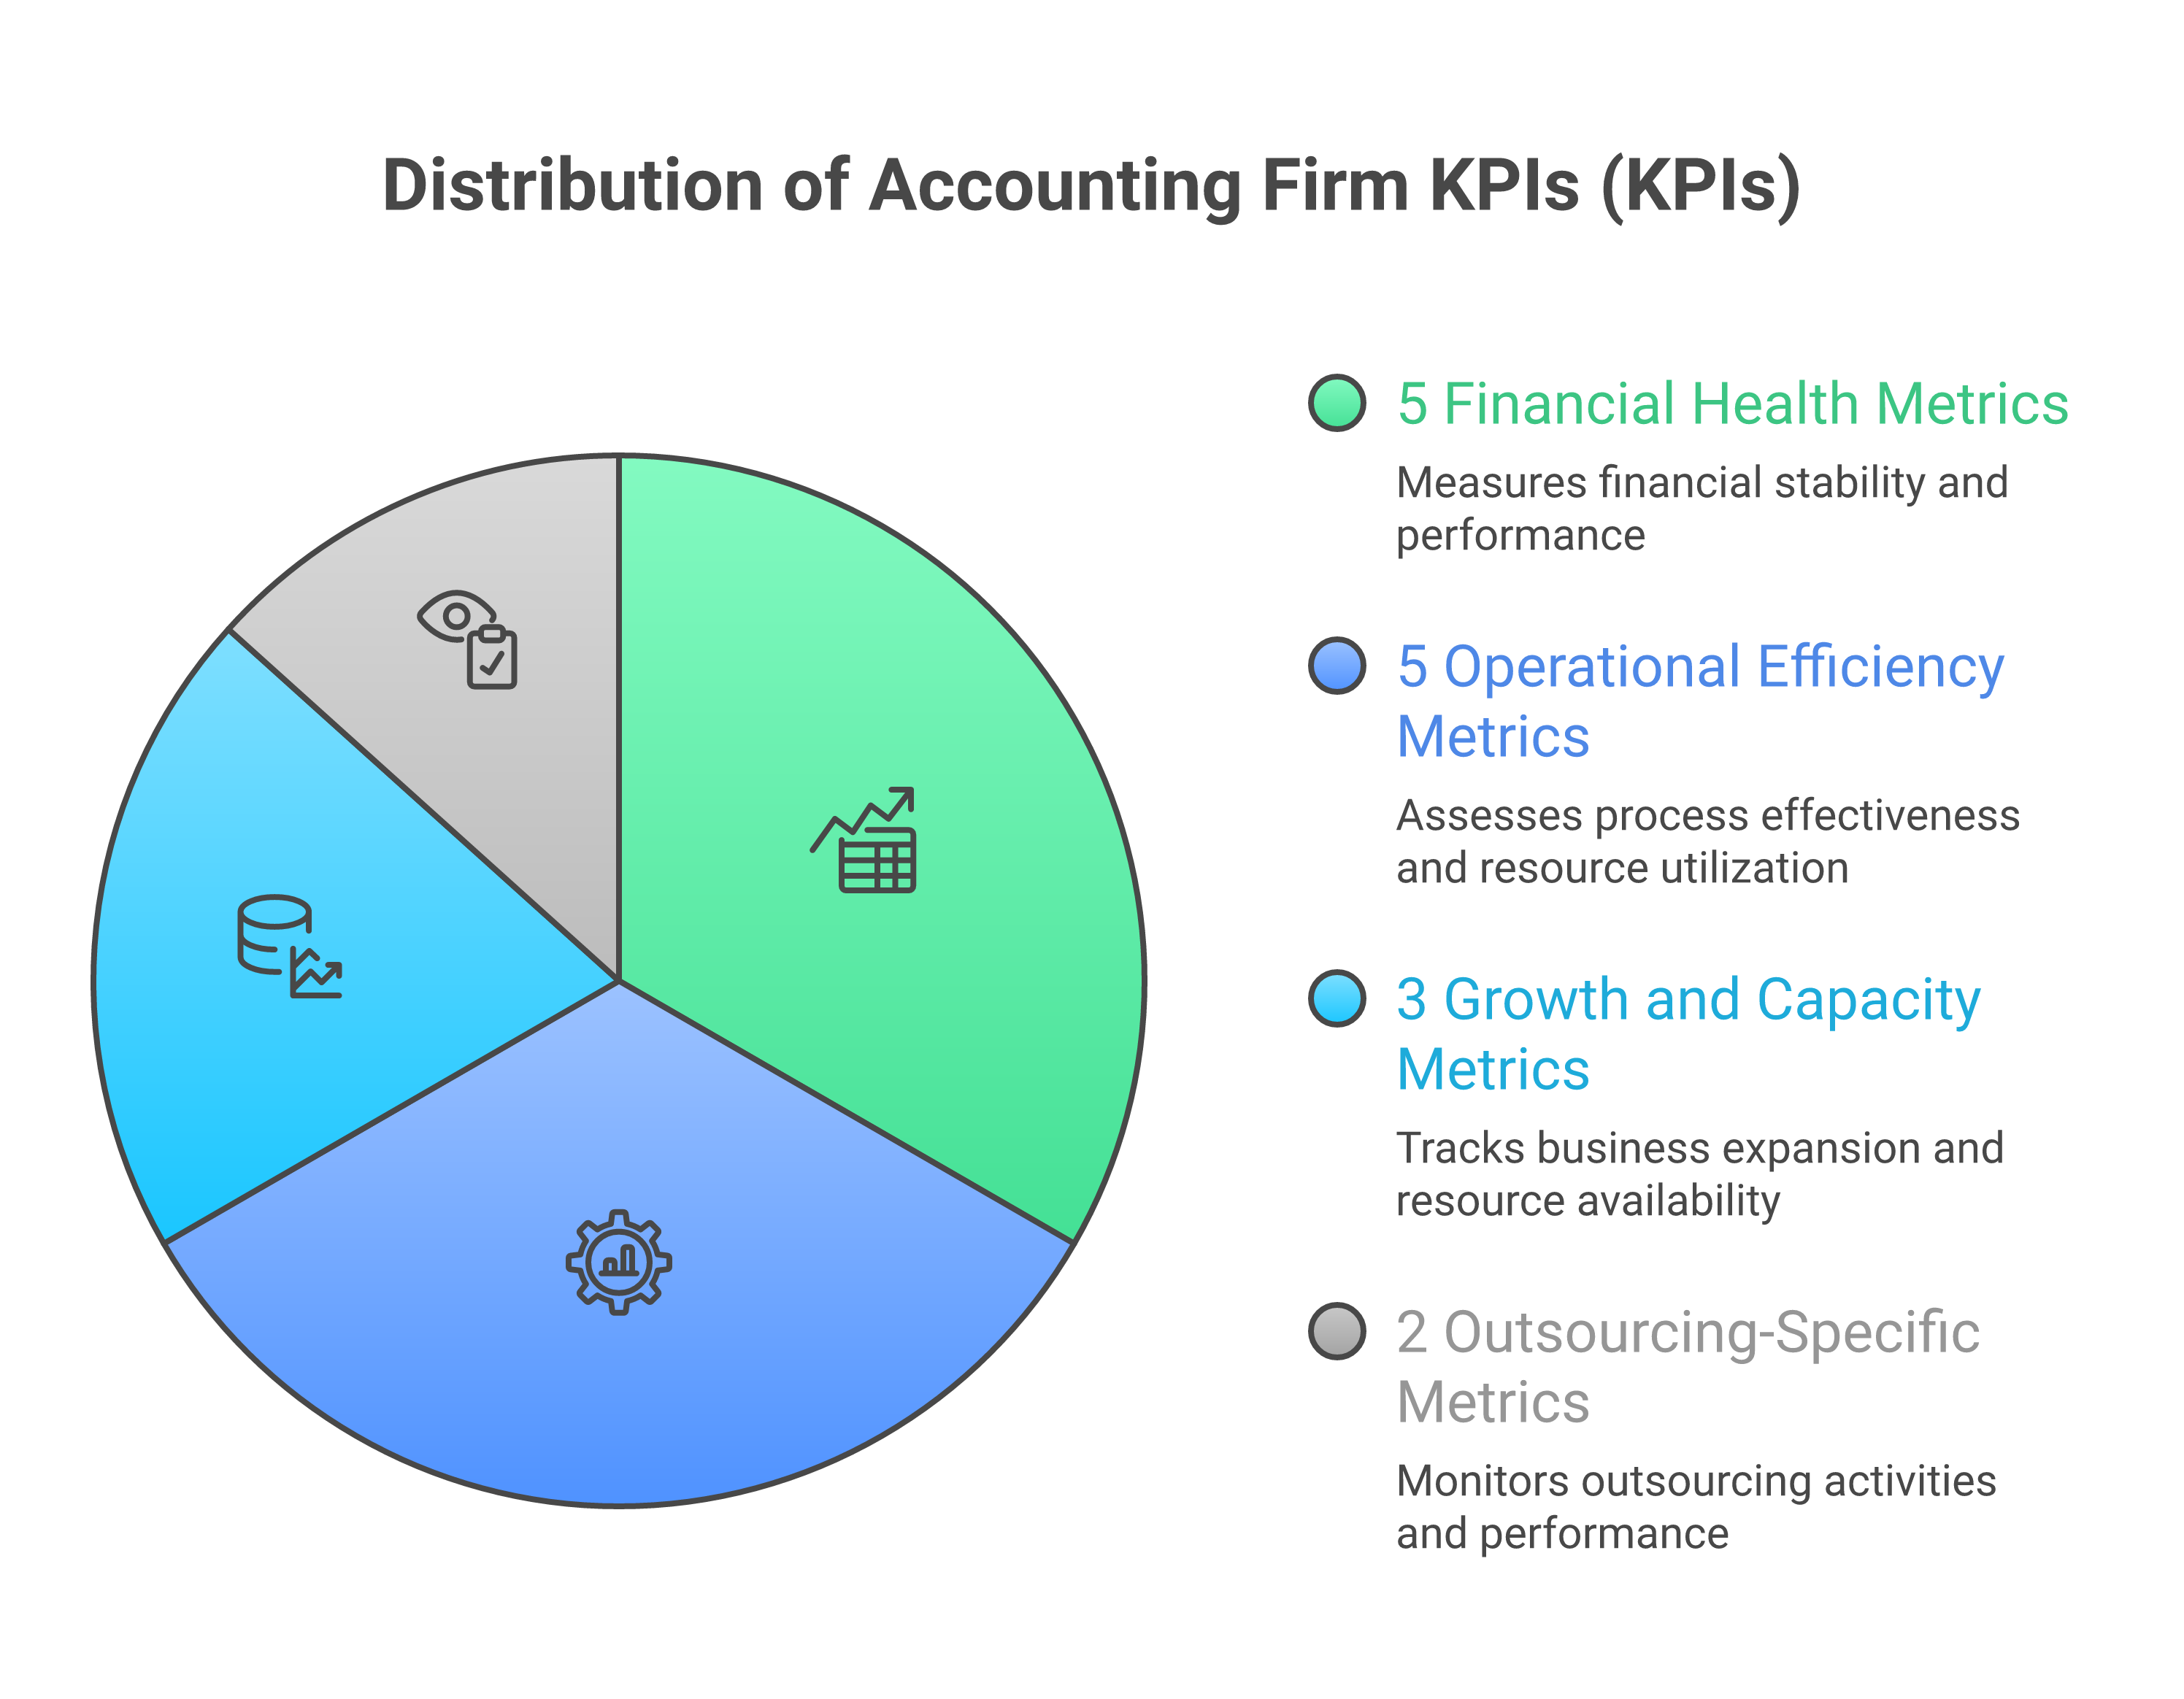
Here are the 15 metrics we recommend, organized by what they measure, with benchmarks from the AICPA MAP Survey and Rosenberg Survey data.
1. Revenue per partner tells you how effectively your ownership group is generating income. The AICPA MAP Survey benchmark for firms under $2M in revenue is $400,000 to $600,000 per equity partner. For firms between $2M and $10M, the target is $600,000 to $900,000. If your number is below these ranges, you either have too many partners or not enough revenue. The solution is usually one of three things: raise prices, improve realization rates, or add capacity through outsourcing so existing partners can serve more clients.
2. Profit margin (income per partner / revenue) is the clearest indicator of firm health. The benchmark for well-run firms is 33 to 40 percent net income as a percentage of revenue. Below 25 percent, something is structurally wrong. Usually it is overstaffing, underpricing, or both. The single fastest way to improve profit margin is to move lower-value work to a lower-cost labor pool, which is exactly what offshore outsourcing does.
3. Realization rate measures what you actually collect versus what you bill. Track it as collected revenue divided by standard billing rate multiplied by hours worked. Target: 85 to 95 percent. Below 85 percent, you are writing off too much time. Common causes: scope creep without rebilling, fixed-fee engagements priced too low, and partners discounting invoices to keep clients happy. Fix the pricing, not the KPI.
4. Revenue per full-time equivalent (FTE) shows your overall labor productivity. The benchmark is $120,000 to $180,000 per FTE depending on service mix and geography. This metric changes dramatically when you add offshore staff because the denominator increases but the cost per FTE drops. A firm with 10 onshore FTEs at $150K revenue per FTE that adds 5 offshore FTEs should target the same total revenue but at a blended cost per FTE that is 30 to 40 percent lower.
5. Client concentration risk measures your dependency on top clients. Calculate your top 5 clients' revenue as a percentage of total revenue. If any single client represents more than 10 percent of revenue, or your top 5 represent more than 30 percent, you have concentration risk that can hurt your firm's valuation. Firm valuation is directly impacted by client concentration.
6. Billable utilization rate is the percentage of available hours that are billed to clients. The target for staff is 75 to 85 percent. For managers, 65 to 75 percent. For partners, 40 to 55 percent (partners should be spending more time on business development and advisory, less on production). If partner utilization is above 60 percent, they are doing too much production work and not enough partner-level activity. This is often the trigger for outsourcing production work.
7. Effective billing rate is actual revenue divided by total hours worked (not just billable hours). This captures the impact of administrative time, training, and unbilled work. If your standard rate is $250 per hour but your effective rate is $165, you have a 34 percent leakage problem. Most of that leakage comes from unbilled administrative work that could be delegated or automated.
8. Days in accounts receivable (AR) measures how fast clients pay. The benchmark is 45 to 60 days. Above 75 days, you have a collections problem that is eating your cash flow. Some firms reduce AR by requiring retainers, offering small discounts for early payment, or automating billing through practice management software. Our KPI reporting guide covers AR management in more depth.
9. Client retention rate should be 90 percent or higher annually. Below 85 percent, you are losing clients faster than most firms can replace them through marketing alone. Calculate it as (clients at end of year minus new clients added) divided by clients at start of year. Track the reason for every departure. If "found a cheaper option" is the top reason, you may have a pricing or value communication problem.
10. Average turnaround time for returns and deliverables directly impacts client satisfaction. Track the number of business days from receiving complete source documents to delivering the draft return or financial statement. Target: 5 to 10 business days for individual returns, 10 to 15 for business returns, 5 for monthly bookkeeping close. Offshore teams often improve this metric because the time zone offset means work gets done overnight.
11. New client acquisition rate and cost tracks how many new clients you add per month and what it costs to acquire them. The median CPA firm adds 3 to 8 new clients per month (varies wildly by firm size). Acquisition cost should be below 10 percent of the client's first-year revenue. If you are spending $2,000 in marketing to land a $3,000 per year tax-only client, the math does not work. Focus marketing on higher-value service offerings.
12. Available capacity (hours) is the number of billable hours your team can deliver that are not currently committed to existing clients. This is the metric that tells you whether you can take on new work or whether you need to add staff. Calculate it as total available billable hours minus committed hours to current clients. When capacity drops below 10 to 15 percent, you need to either hire, outsource, or stop taking new clients. Our capacity planning guide covers how firms use outsourcing as a capacity release valve.
13. Revenue pipeline value estimates the annualized revenue from proposals outstanding and prospects in active conversations. Firms with the steadiest growth maintain a pipeline that is 20 to 30 percent of current revenue at any given time. If your pipeline is thin, your marketing and business development effort is insufficient.
If your firm uses offshore or outsourced support, these two metrics are non-negotiable.
14. Offshore team quality score tracks the accuracy of work produced by your outsourced team. Measure it as the percentage of deliverables that pass your review process with fewer than 3 review notes. Target: 90 percent or higher within 90 days of onboarding, 95 percent or higher after 6 months. Track this weekly during the first 90 days and monthly after that. If the score is below 85 percent after 90 days, something is wrong with the training, the team, or the provider.
15. Cost per engagement (blended) measures the total labor cost to deliver a specific engagement, combining onshore and offshore hours. For a monthly bookkeeping engagement, calculate: (onshore review hours multiplied by onshore hourly cost) plus (offshore production hours multiplied by offshore hourly cost). Compare this to your client fee. If the cost per engagement exceeds 40 percent of the client fee, you are either underpricing or over-servicing. The target is a cost-to-fee ratio of 25 to 35 percent, leaving 65 to 75 percent gross margin on each engagement. This is where outsourcing ROI becomes measurable, not theoretical.
Tracking 15 KPIs is only useful if you review them regularly and take action when the numbers move. Here is the cadence we recommend.
Weekly: Review offshore quality score and turnaround times. These are leading indicators. If quality is slipping, you want to catch it in week 2, not month 3.
Monthly: Review all 15 metrics at your partner meeting. Focus discussion on the 2 or 3 metrics that are furthest from benchmark. Assign specific actions with owners and deadlines.
Quarterly: Trend analysis. Are your metrics improving, flat, or declining? Look at 3-month moving averages rather than single-month snapshots to smooth out seasonal variation.
Annually: Recalibrate benchmarks. Salary data changes, billing rates change, your service mix evolves. Update your targets based on current market conditions and firm strategy.
The most common mistake firms make with KPI tracking is collecting the data but making it too difficult to access. If pulling the numbers requires opening five different systems and an hour of spreadsheet work, nobody does it consistently.
We recommend building a single-page dashboard that auto-populates from your existing systems wherever possible. Karbon and Canopy both offer reporting dashboards that pull task completion data, utilization, and engagement status automatically. QBO and Xero provide revenue and AR data through their reporting modules. The offshore quality score and cost per engagement metrics may require a simple spreadsheet that gets updated weekly.
In our experience, the firms that get the most value from KPI tracking are the ones where the managing partner can open one page (whether that is a Karbon dashboard, a Google Sheet, or a simple BI tool) and see all 15 metrics updated to current. The act of making the data visible creates accountability. When everyone at the partner meeting can see that realization rate dropped 3 points last month, the conversation about fixing it happens naturally.
We share dashboard templates with our CPA firm clients and help them set up the data feeds from their practice management and accounting systems. The setup takes a day. The ongoing maintenance takes 30 minutes per week. The visibility it provides is worth far more than that investment.
Several of these metrics serve as natural triggers for outsourcing conversations. In our experience, firms that wait until the pain is severe before exploring outsourcing end up making hasty decisions. The better approach is to watch for early warning patterns.
If partner utilization consistently exceeds 60 percent, your partners are spending too much time on production. If available capacity drops below 10 percent for three consecutive months, you are approaching a service quality cliff. If turnaround times are trending upward while your client count is stable, your team is struggling to keep pace. And if your profit margin is declining despite stable revenue, your labor costs are growing faster than your pricing.
Any two of these signals appearing simultaneously is a strong indicator that outsourcing can improve firm performance. Rather than waiting until all four align (at which point you are in crisis mode), proactive firms use the early signals to begin evaluating providers, running pilots, and planning the transition during a period of relative calm.
If you want help setting up KPI tracking for your firm, including outsourcing-specific metrics, reach out at madrasaccountancy.com. We can share the dashboard templates we use with our CPA firm clients.
Revenue per partner. It captures the combined effect of pricing, realization, productivity, and leverage. A firm with $800,000 revenue per partner is almost certainly healthy across most other metrics. A firm with $350,000 revenue per partner has structural issues that show up in every other KPI.
Revenue per FTE will initially decrease because you are adding headcount. But cost per FTE drops faster, so profit margin improves. The key metric to watch is cost per engagement (metric 15). If your blended cost to deliver an engagement drops 30 to 40 percent when you add offshore staff while the client fee stays the same, your margins are improving even though your headcount-based metrics look different.
Weekly for the first 90 days of any new outsourcing relationship. After that, monthly is sufficient if quality scores are consistently above 90 percent. If quality drops below 85 percent in any given month, go back to weekly reviews until it recovers. Our quality control guide covers the review process in detail.
The AICPA MAP Survey (published annually, available to AICPA PCPS members) provides benchmarks segmented by firm revenue. The Rosenberg Survey covers the top 300 firms. For firms under $5M in revenue, the MAP Survey is more relevant. Use the 75th percentile as your target rather than the median, because median performance means half the profession is doing better than you.
Yes. We have seen firms build dashboards with 40 or 50 metrics that nobody looks at because the volume of data is overwhelming. Fifteen is the right number because it covers financial health, operational efficiency, growth, and outsourcing performance without creating information overload. If a metric does not change a decision you would make, it does not belong on your dashboard.
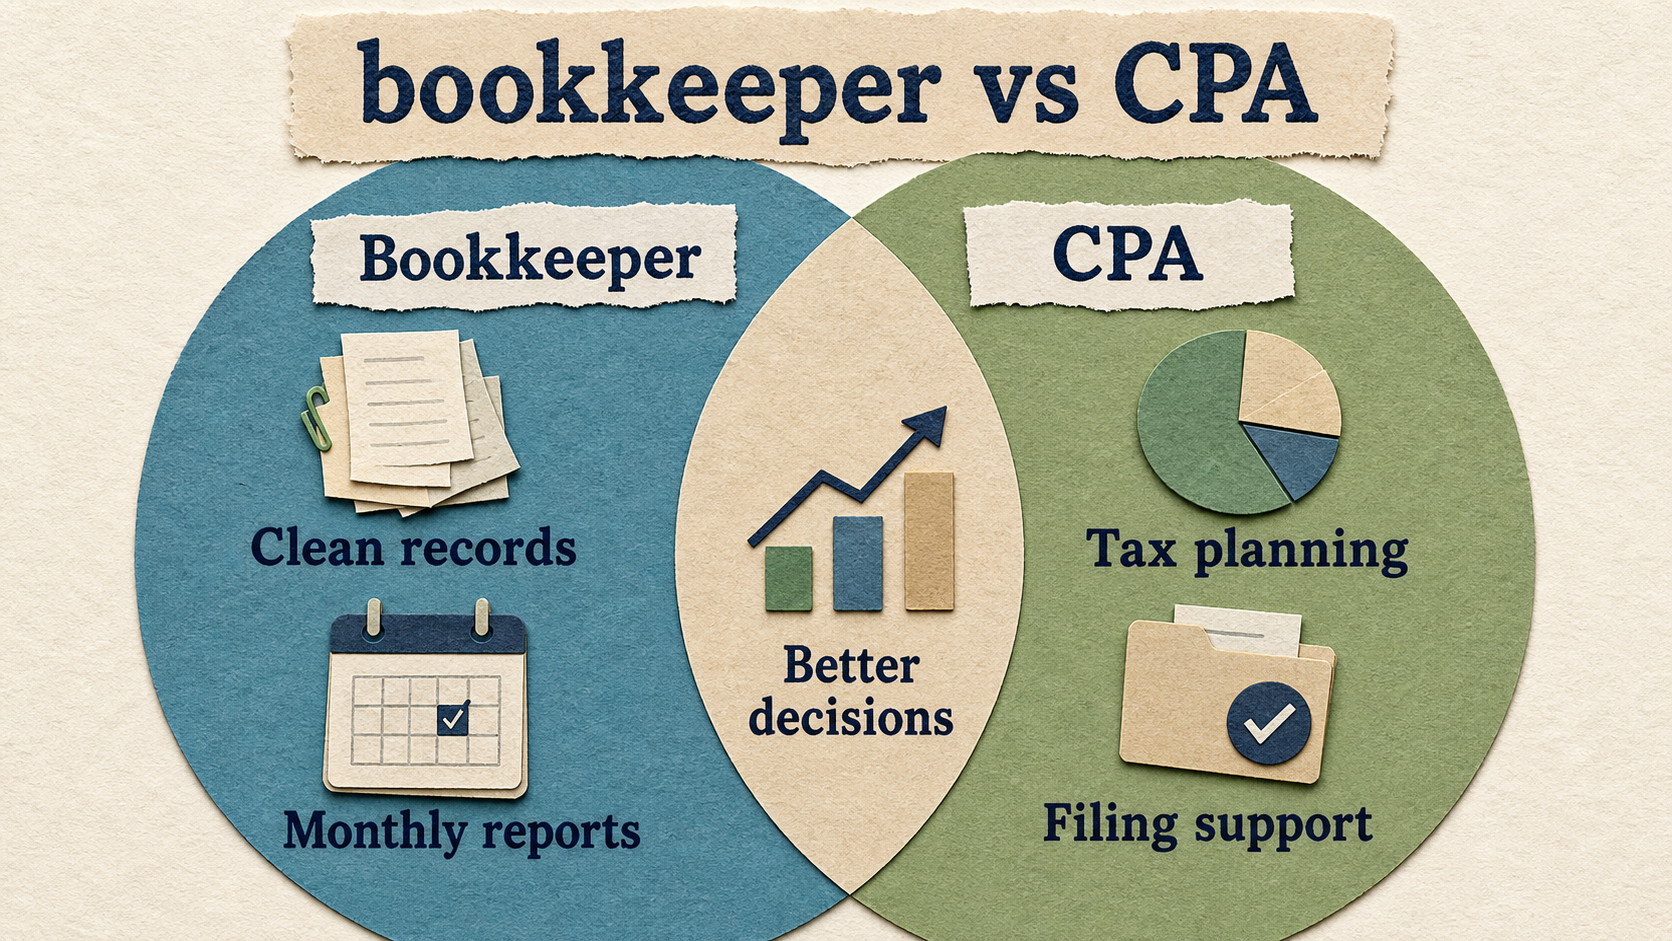
Compare a bookkeeper and CPA so your business knows when it needs recordkeeping, tax filing, planning, or higher-level advice.
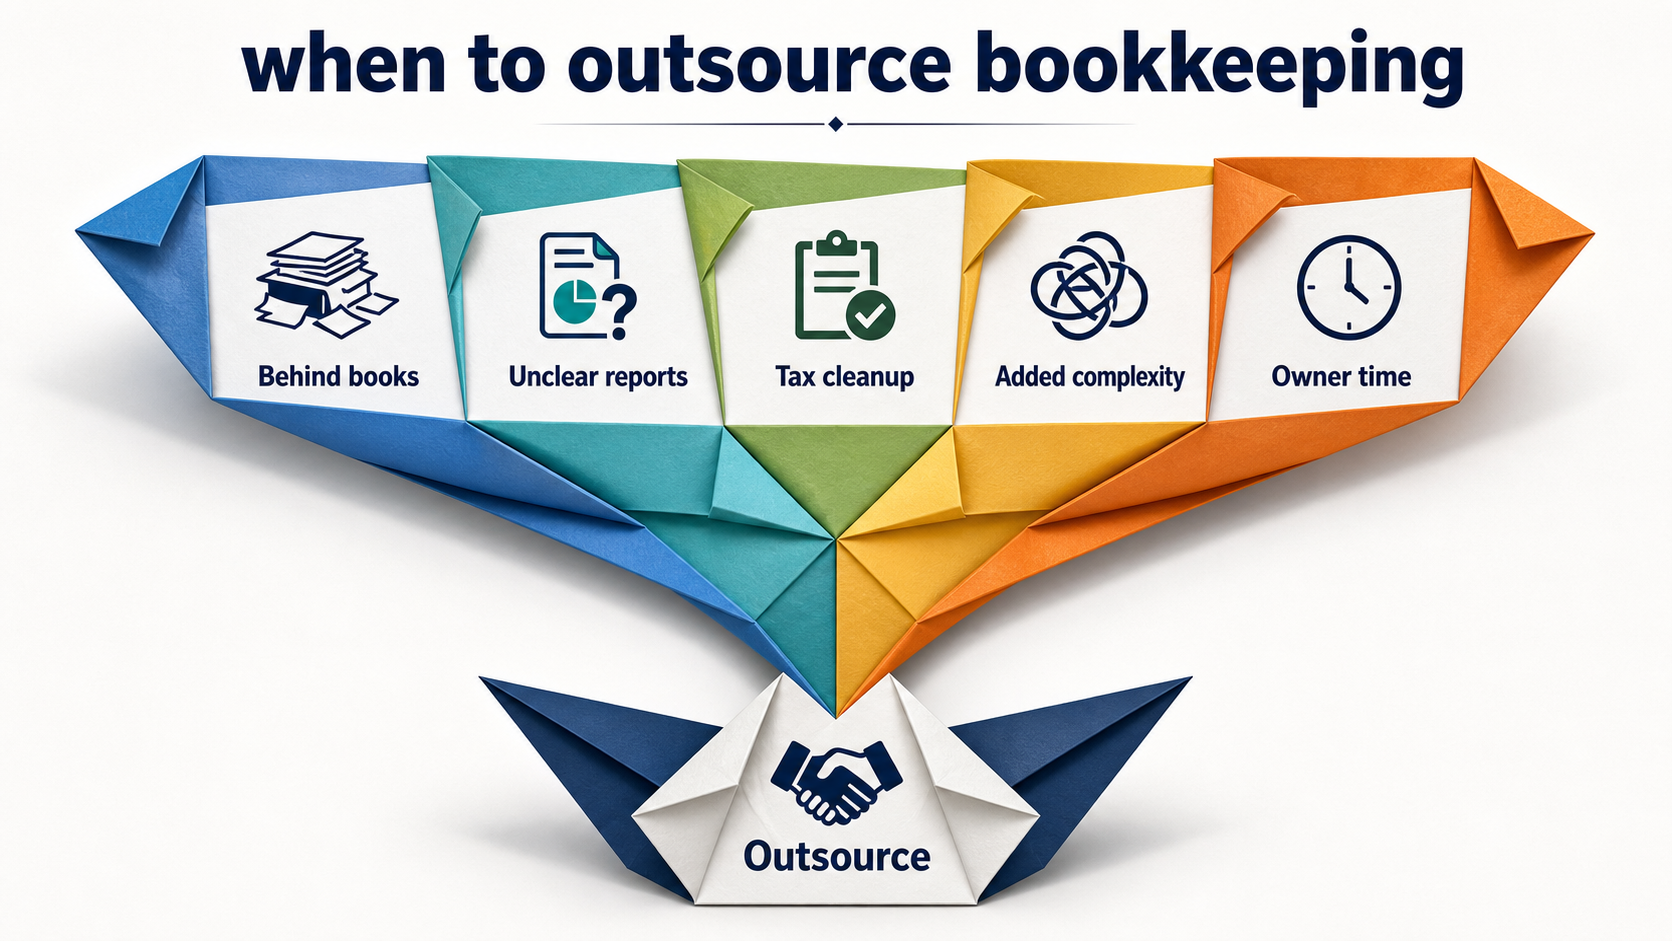
Learn when to outsource bookkeeping, what tasks to hand off first, and how outsourced bookkeeping supports tax planning and decisions.
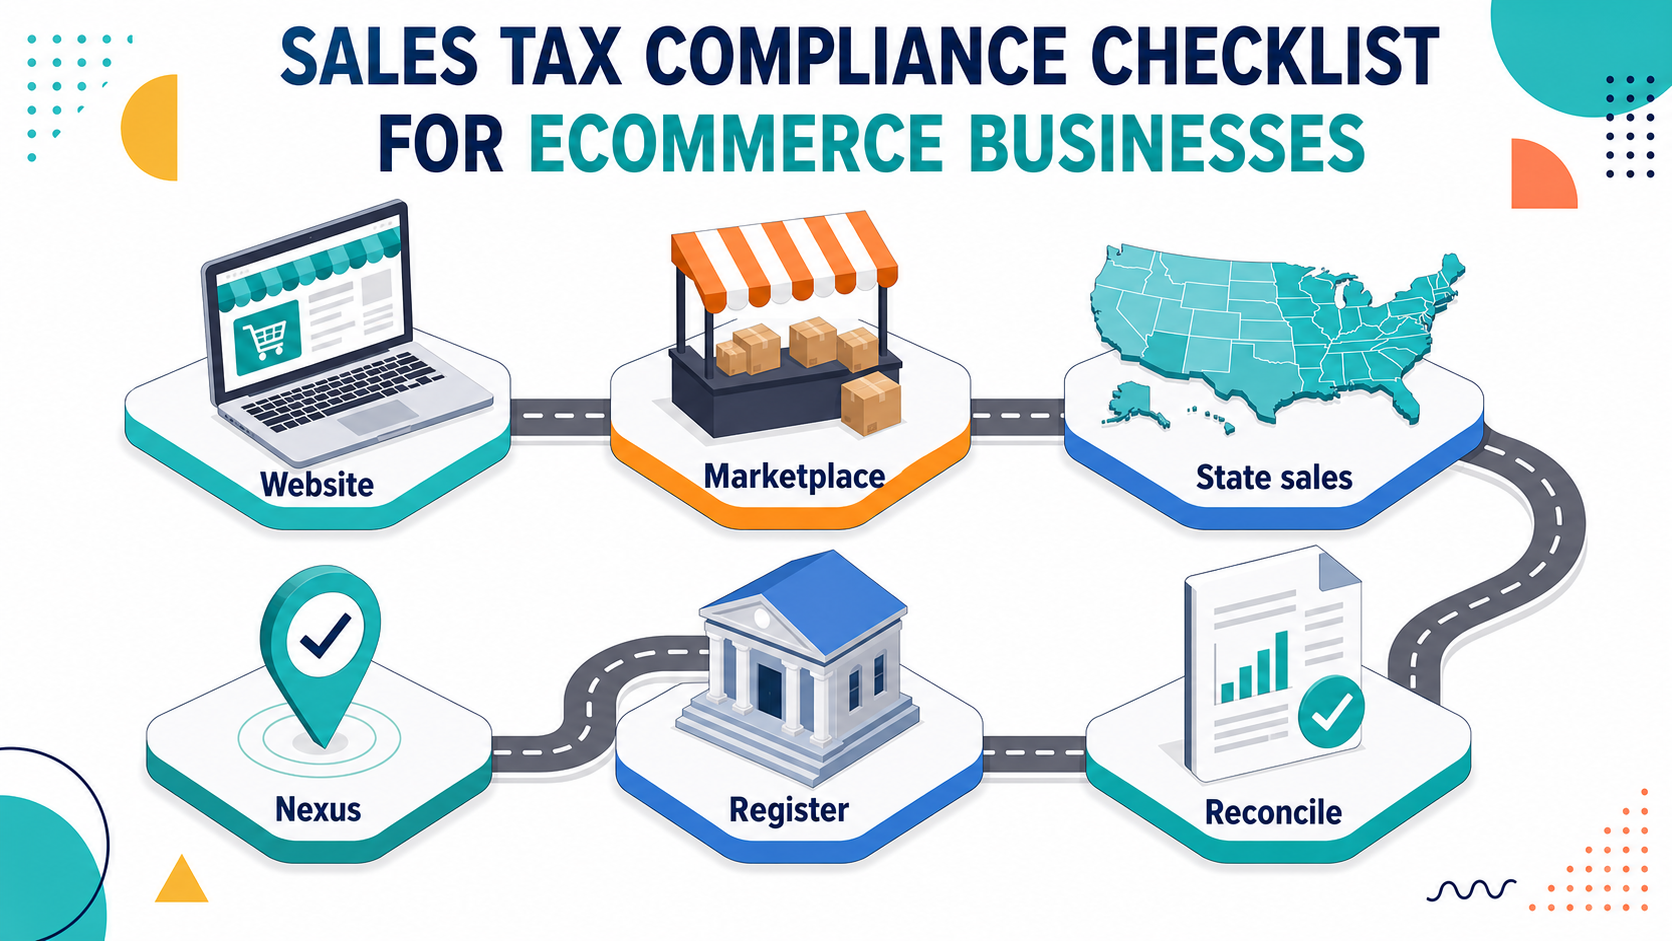
Use this ecommerce sales tax checklist to review nexus, registrations, marketplaces, product taxability, filings, and bookkeeping records.